
Per our own study of 30 tracked launches, one canonical post per product was measured across a 9-month window.
FORKOFF RADAR · Research · Published 2026-07-24 · n=30 launches · 110.4M views
The State of Launch Videos 2026
A first-party report on 30 tracked product launches on X, totaling 110.4 million combined views. The headline finding: 67 percent carried a distribution-amplified reach signature, and 33 percent read organic on a full forensic trace. Every number is computed live from the dataset below.
30 tracked public launches, Oct 2025 to Jun 2026, reported in aggregate bands. Recomputed as the tracked set grows.
30
Tracked launches
110.4M
Combined views
67%
Carry an amplified signature
788
Median views per like
The state of launch videos, in one answer
The state of launch videos in 2026 is that reach and authenticity have split. Across 30 tracked public product launches on X totaling 110.4 million combined views, the typical launch reached about 3,098,892 views, yet 20 of the 30 launches (67 percent) carried a distribution-amplified reach signature, while only 10 (33 percent) read organic on a full forensic trace. The median launch ran 788 views per like; the amplified cohort ran 1,441, about 4.1 times the organic cohort's 354. Amplified distribution is legal and common, so these are reads on how reach was built, not verdicts on any product or founder. The full dataset and method are published below so every figure can be re-derived.
This report reads how launch reach was built, never whether anyone was honest. A high views-to-likes ratio is a read on mechanics, and paying for or coordinating distribution is a legal, ordinary launch tactic.
Why 30 verifiable launches beat a bigger, unverifiable number
Launch-video benchmarks circulate with big round sample counts and no dataset behind them. A benchmark you cannot audit is not a benchmark, it is a claim. This report takes the opposite bet: 30 tracked launches, every one a public post with public metrics, deduplicated to a single canonical launch post per product, 18 of them carrying a full forensic trace, and the complete dataset published as a CSV under CC BY 4.0. Small and reproducible outranks large and opaque, because a reader, an analyst, or an answer engine can re-derive every figure here from the source.
Every launch is public
All 30 launches are public posts with public view, like, reply, and quote counts, pulled via our own X data pipeline. Nothing here is a private or unnamed data point.
The dataset ships
The full aggregate dataset downloads as a CSV under CC BY 4.0. The numbers on this page and the numbers in the file come from the same single source, so they cannot disagree.
The method is disclosed
A full forensic trace is verified on 18 of the 30 launches; the rest are read from the public views-to-likes ratio at lower confidence, and labeled as such.
Launch reach across 6 verticals
The tracked launches span 6 product verticals. AI leads on combined reach with 7 launches and 42.8 million views. The vertical is a neutral product-domain tag, never a verdict, and per-vertical cuts on a 30-launch set are directional rather than definitive.
| Vertical | Launches | Combined views | Median views per like | Read organic |
|---|---|---|---|---|
| AI | 7 | 42,809,039 | 568 | 3 of 7 |
| Marketing and Sales | 9 | 27,551,311 | 821 | 1 of 9 |
| Consumer and Health | 4 | 15,141,230 | 892 | 1 of 4 |
| Dev tools | 5 | 13,141,341 | 754 | 2 of 5 |
| Fintech | 3 | 7,972,752 | 724 | 1 of 3 |
| Crypto/Web3 | 2 | 3,802,959 | 1,420 | 2 of 2 |
| All verticals | 30 | 110,418,632 | 788 | 10 of 30 |
FORKOFF RADAR launch dataset, n=30, Oct 2025 to Jun 2026. Verticals are neutral product-domain tags. Counts recomputed live from the tracked set.
How far launch videos actually reach
The median tracked launch reached about 3,098,892 views, but the distribution is heavily skewed. Reach is grouped into public view-count bands below. These are aggregate counts of how many launches landed in each reach tier, a factual read on the ceiling a launch video hits, not a verdict on any of them.
2
10M and over views
7% of tracked launches
4
5M to 10M views
13% of tracked launches
19
1M to 5M views
63% of tracked launches
5
under 1M views
17% of tracked launches
What an organic launch looks like
The three biggest launches RADAR reads as organic, reach and engagement that grew together. Each links to its full reading.
Two in three launches ran ahead of their engagement
20 of the 30 tracked launches (67 percent) carried a distribution-amplified reach signature; 10 (33 percent) read organic. The organic cohort ran a median of 354 views per like, the amplified cohort 1,441, about 4.1 times higher. That gap is the whole finding: amplified reach runs further ahead of the likes than organic reach ever does.
The full band calibration, the distribution chart, and the reproduce-it-yourself steps live on the views-to-likes benchmark, the sibling study this split is measured on.
The market these launches sit inside, sourced
The first-party numbers above are X-native and measured on this tracked set. The figures below are named third-party benchmarks that frame the market a launch video competes in. They are directional context, each with its source and year, never pooled into this report's first-party numbers.
91%
of businesses use video as a marketing tool in 2026, back to an all-time high.
Wyzowl State of Video Marketing 2026, 202693%
of video marketers say video is an important part of their overall marketing strategy.
Wyzowl State of Video Marketing 2026, 202682%
of marketers say video marketing gives them a good return on investment.
Wyzowl State of Video Marketing 2026, 202683%
of video marketers say video has directly helped them increase sales.
Wyzowl State of Video Marketing 2026, 202682%
of video marketers say video has helped them increase website traffic.
Wyzowl State of Video Marketing 2026, 202685%
of people say they have been convinced to buy a product or service by watching a video.
Wyzowl State of Video Marketing 2026, 202696%
of people have watched an explainer video to learn more about a product or service.
Wyzowl State of Video Marketing 2026, 202684%
of consumers say they want to see more video content from brands in 2026.
Wyzowl State of Video Marketing 2026, 202689%
of consumers say a video's quality directly impacts how much they trust the brand behind it.
Wyzowl State of Video Marketing 2026, 202663%
of people say a short video is how they would most like to learn about a new product or service, well ahead of text.
Wyzowl State of Video Marketing 2026, 202686%
of ad buyers now use or plan to use generative AI to build video creative.
IAB 2025 Digital Video Ad Spend and Strategy Report, 20250.12%
is X's per-follower engagement floor, the lowest of the major platforms, so a launch video's raw view count cannot be read at face value.
Socialinsider Social Media Benchmarks 2026, 2026External figures are reported as published by their named sources, read live against the source page on the last-updated date. Put together they frame the stakes: video is now used by almost every business and converts, generative AI is standard in production, and X carries the lowest engagement floor of the major platforms, which is exactly why a launch video's raw view count needs the views-to-likes read to be understood.
How the report was measured
The report is computed from 30 public product-launch posts on X, launched across Oct 2025 to Jun 2026, totaling 110.4 million combined views. Collection is public post metrics pulled via our own X data pipeline, deduplicated to one canonical launch post per product, with a full forensic trace verified on 18 of the 30 launches and the rest read from the public views-to-likes ratio at lower confidence. Every number on this page is recomputed from that set, so the report refreshes as the corpus grows.
Sample
30 launches
110.4M combined views
Window
Oct 2025 to Jun 2026
9-month tracked set
Collection
our own X data pipeline
18 of 30 verified trace, deduped
The views-to-likes ratio is the load-bearing signal because it is a pure function of two public numbers, reproducible by anyone from the public post. The organic ceiling near 500 views per like and the calibration bands come from the published RADAR methodology. A verified trace adds the amplification-wave shape and the posting-time fingerprint as corroboration, but the ratio anchors every read.
Caveats, stated plainly. The sample is 30launches, so per-vertical cuts are directional, not definitive. Metrics are point-in-time and trace to a public pull; bot purges and late engagement shift the numbers, which is why the set is re-checked and dated. Reads without a full trace are never rendered as high-confidence bought verdicts. And amplified distribution is a legal, common, often-sound way to launch at scale, so a high ratio is a read on how reach was built, not a claim about anyone's honesty.
The CSV carries the aggregate overview, the per-vertical breakdown, the reach bands, the ratio percentiles, and the anonymized per-launch ratio distribution. Launch-level rows are anonymized by design: the file publishes distributions, not a per-named verdict.
Adjacent RADAR reading
- Launch Radar hub , the tracked launches ranked by reach, each with its public metrics and views-to-likes ratio.
- Best product launch videos, ranked , the tracked launch videos ordered by views, each with the same reach read applied.
- Views-to-Likes Benchmark 2026 , the sibling study with the full band calibration this report's organic vs amplified split is measured on.
- RADAR methodology , how RADAR reads whether a launch's reach was earned or amplified, from three public signals, with the full calibration.
- Product Launch Video , the managed launch service this report comes out of, priced on audited reach rather than a production fee.
State of launch videos, common questions
Frequently asked questions
What is the state of launch videos in 2026?
Across 30 tracked public product launches on X totaling 110.4 million combined views, the typical launch reached about 3,098,892 views, and reach ran well ahead of engagement more often than not. 20 of the 30 launches (67 percent) carried a distribution-amplified reach signature, while 10 (33 percent) read organic on a full forensic trace. The median launch ran 788 views per like, and the amplified cohort ran 1,441, about 4.1 times the organic cohort's 354. Amplified distribution is legal and common, so these are reads on how reach was built, not verdicts on any product or founder.
How many views does a product launch video get?
In this tracked set the median launch reached about 3,098,892 views, with the 30 launches totaling 110.4 million combined views. Reach is heavily skewed: 19 of the 30 sat in the 1M to 5M band, a handful cleared 5M, and a few landed under 1M. A big raw view count on its own does not tell you whether reach was earned or amplified. The views-to-likes ratio is what separates the two.
Why publish only 30 launches instead of a bigger number?
Because a benchmark you cannot audit is not a benchmark. Every one of these 30 launches is a public post with public metrics, pulled via our own X data pipeline, deduplicated to one canonical launch post per product, with a full forensic trace verified on 18 of the 30. The complete dataset ships as a CSV under CC BY 4.0 and the method is published, so anyone can re-derive every number. A larger set with no dataset behind it is a claim, not evidence. Verifiable and small beats unverifiable and large.
Which vertical launches biggest?
AI leads the tracked set on combined reach, with 7 launches totaling 42.8 million views. The set spans 6 verticals in all, from AI and developer tools to fintech, crypto, marketing, and consumer and health. Per-vertical cuts on a 30-launch set are directional rather than definitive, which the report states plainly.
What is a good views-to-likes ratio for a launch video?
On X, organic reach tops out near 500 views per like, the point where reach and engagement grew together. Across these launches the median was 788 views per like and the 90th percentile was 3,126. The organic launches ran a median of 354, the amplified launches 1,441. Lower is closer to organic. The full band calibration lives on the views-to-likes benchmark.
Is a launch video with millions of views fake?
Not necessarily. A high view count paired with the likes, replies, and quote-posts to match is genuine reach that connected with a real audience. A high view count with the engagement far behind it is the signature of distribution-amplified reach. Paying for or coordinating distribution is legal and common, so a wide gap describes how the reach was built, not whether anyone was dishonest.
How was this report measured?
The report is computed from 30 public product-launch posts on X, launched across Oct 2025 to Jun 2026, totaling 110.4 million combined views. Collection is public post metrics (views, likes, replies, quotes, reposts) pulled via our own X data pipeline, deduplicated to one canonical launch post per product, with a full forensic trace on 18 of the 30 launches and the rest read from the public views-to-likes ratio at lower confidence. Every figure is recomputed from that set, so the report refreshes as the corpus grows.
Can I download the launch video dataset?
Yes. The full dataset ships as a CSV under CC BY 4.0, carrying the aggregate overview, the per-vertical breakdown, the reach bands, the ratio percentiles, and the anonymized per-launch ratio distribution. Launch-level rows are anonymized by design, so the file publishes distributions, not a per-named authenticity verdict. Attribution is FORKOFF (2026), State of Launch Videos 2026.
Authorship
Simba
Launch Intelligence Analyst, FORKOFF
Reviewed by: Kshitij JK
Last reviewed:
Published:
Methodology
FORKOFF RADAR launch dataset: 30 public product-launch posts on X, Oct 2025 to Jun 2026, 110.4M combined views. Reach and views-to-likes ratio computed per launch; organic ceiling near 500 views per like from the published RADAR methodology. Full forensic trace on 18 of 30 launches; the rest read from the public ratio at lower confidence. Numbers recomputed live as the set grows.
Sources cited
- RADAR methodology , FORKOFF
- Launch Radar hub , FORKOFF
- Views-to-Likes Benchmark 2026 , FORKOFF
- IAB 2025 Digital Video Ad Spend and Strategy Report , IAB
The measurement side of how FORKOFF moves
Want a launch video that earns its reach?
This report grows out of running managed launches at the scale where the difference between earned and amplified reach stops being a guess and becomes a measured signal. Talk to a strategist about a launch built to earn its ratio.
Receipts, deep dives, and playbooks.
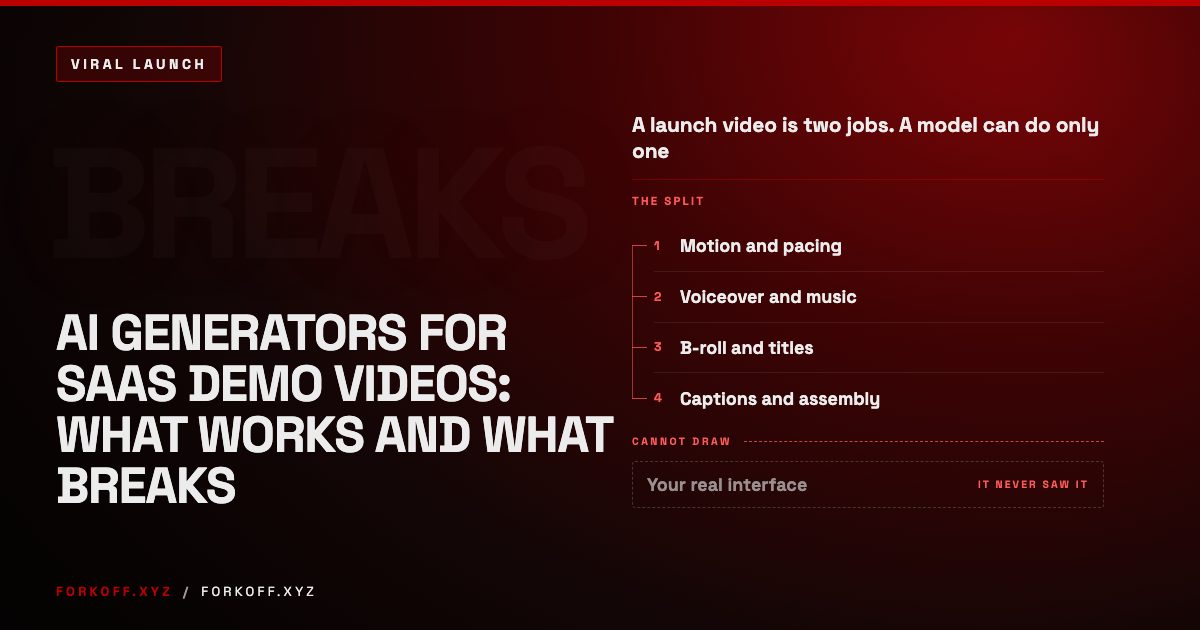
AI Generators for SaaS Demo Videos: What Works and What Breaks
AI video generators handle motion, voiceover and pacing well and draw your interface badly. Which half of a launch video to give a model, which half to keep.
 Read
Read
Why Sora Went Viral in 5 Days, and Dead in 6 Months
OpenAI's Sora beat ChatGPT to 1M downloads, then shut down 6 months later. The public download, revenue, and moderation data behind both halves.
Read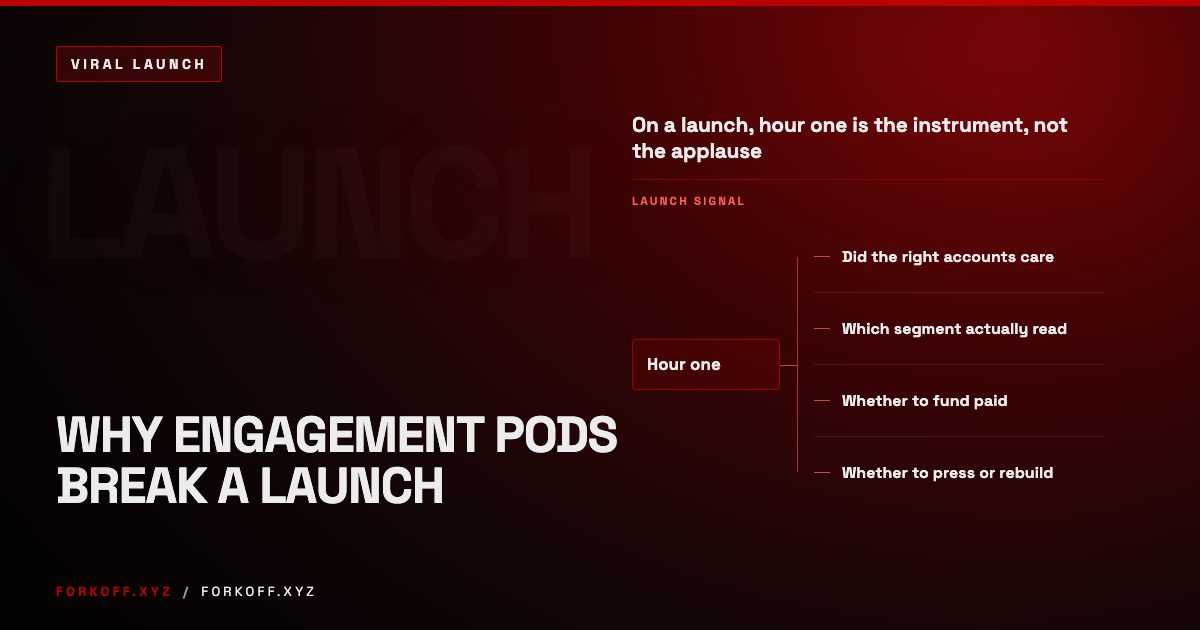
Why Engagement Pods Break a Launch
On an ordinary post a pod costs you some reach. On a launch it costs you the only measurement you had. LinkedIn's own trust VP explains where the penalty lands.
Read