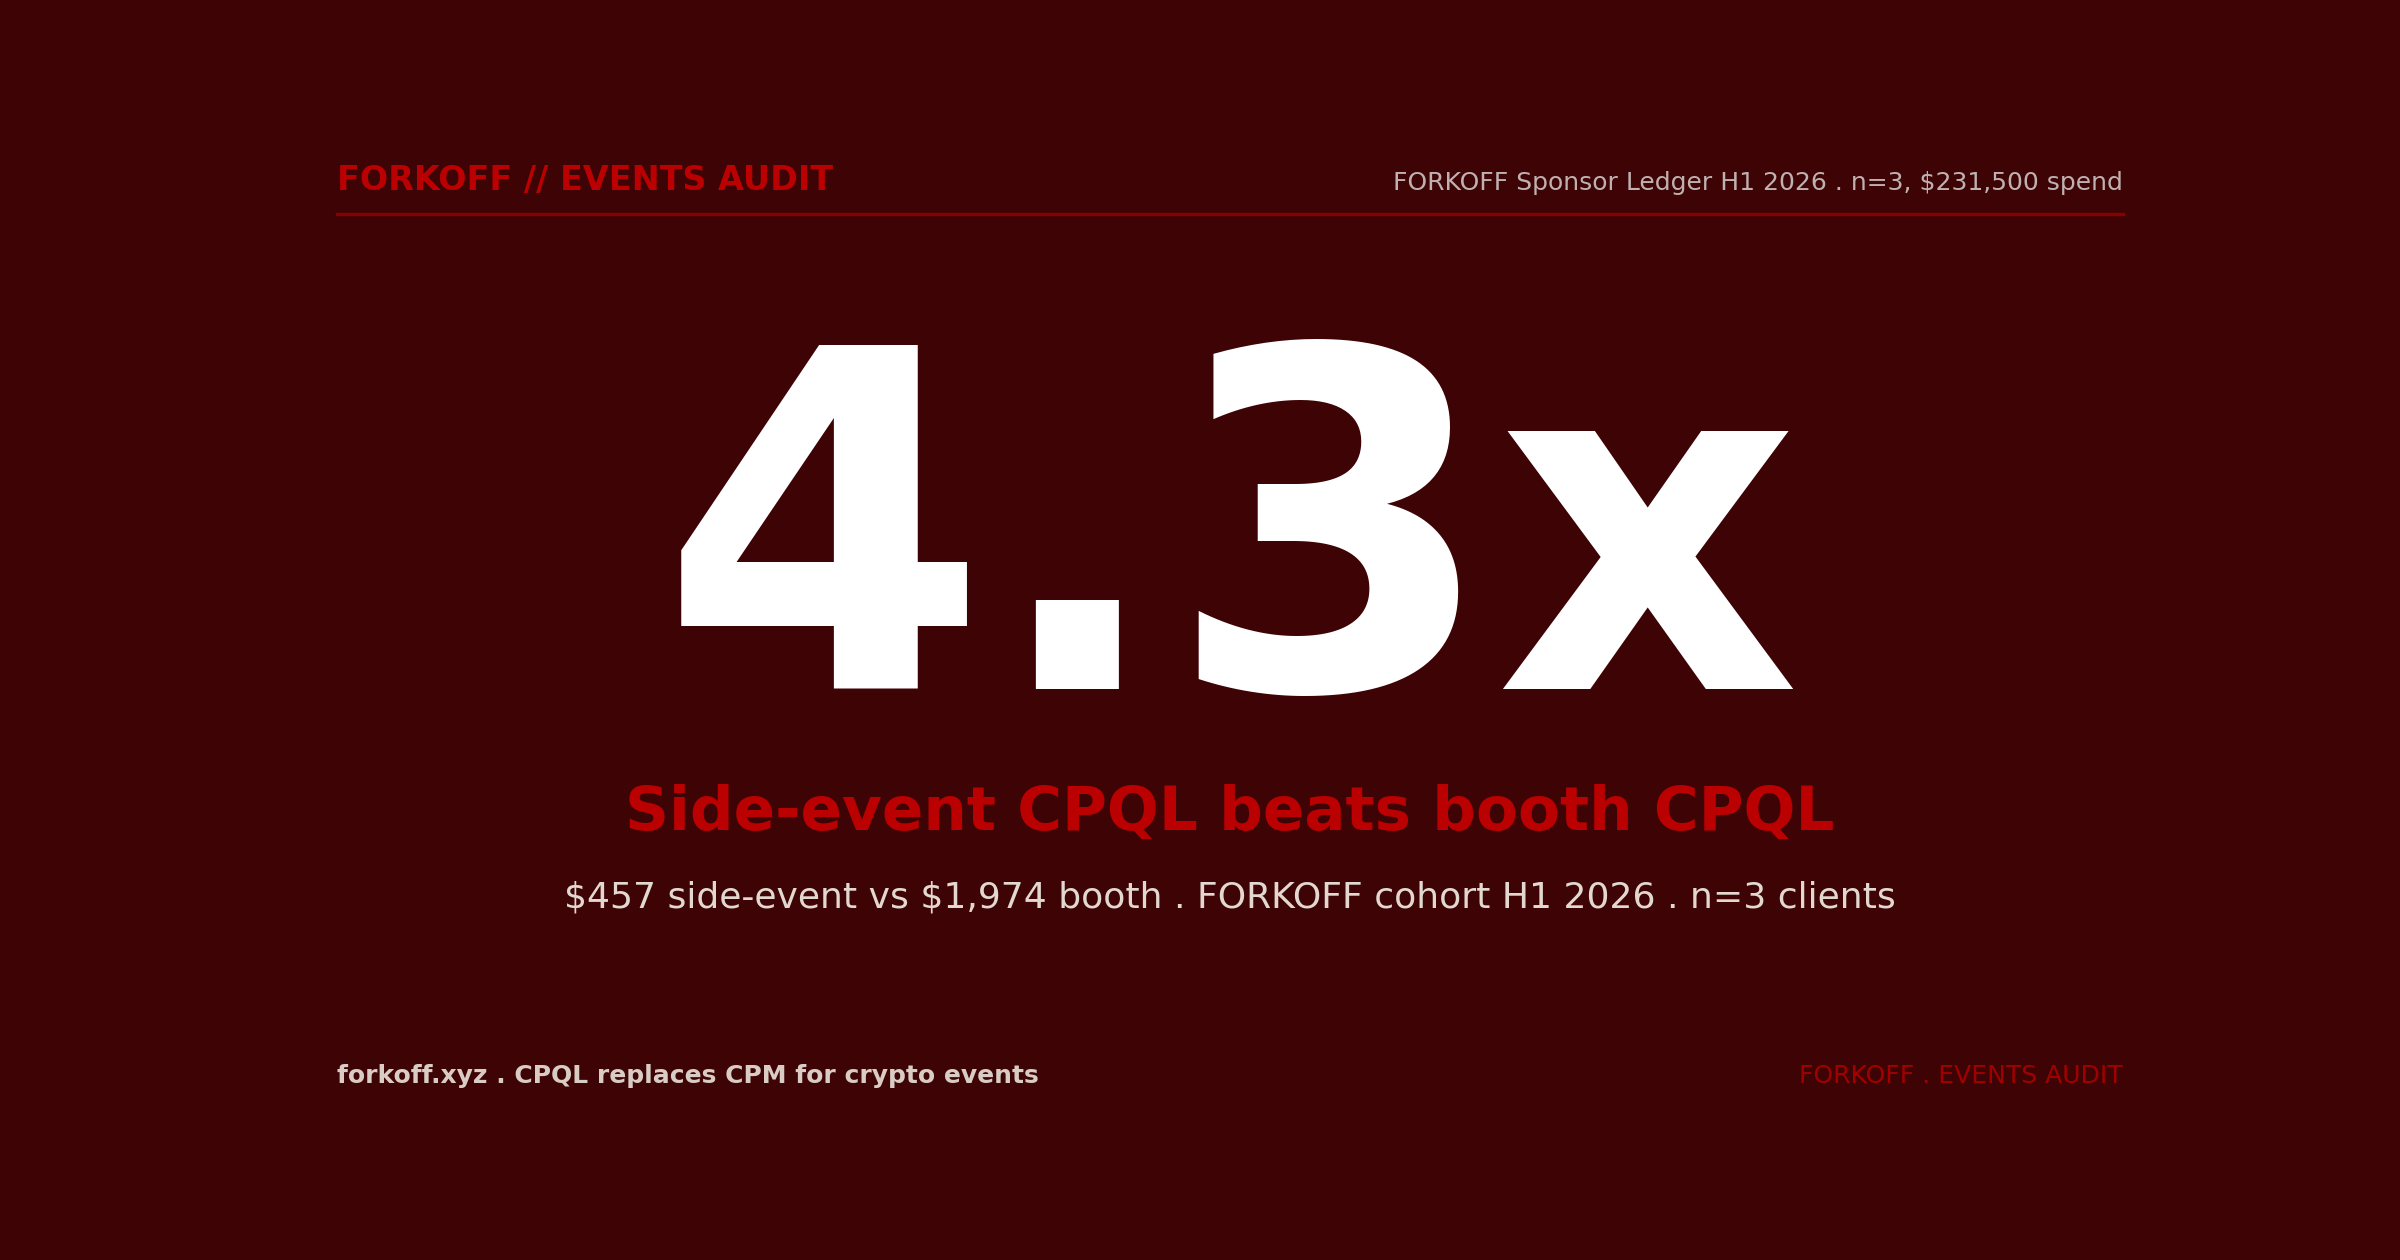
Crypto event sponsorship in 2026 is a CPQL game. Across the FORKOFF Sponsor Ledger H1 2026 (n=3 clients, $231,500 spend at ETHCC[9] Cannes and Token2049 Dubai), the side-event CPQL ran $457 vs the booth-only CPQL at $1,974, a 4.3x spread. The 5-layer activation stack (Luma invite, side event, sponsored dinner, clip layer, follow-up cadence) produced a 67% repeat-sponsor rate against the 30-40% industry benchmark, and 47 clips drove 3M combined views in the 60-day post-event window. This post is the full operating system, and the same CPQL discipline the best event marketing agencies run for sponsors.
Crypto event sponsorship 2026, the CPQL operating system
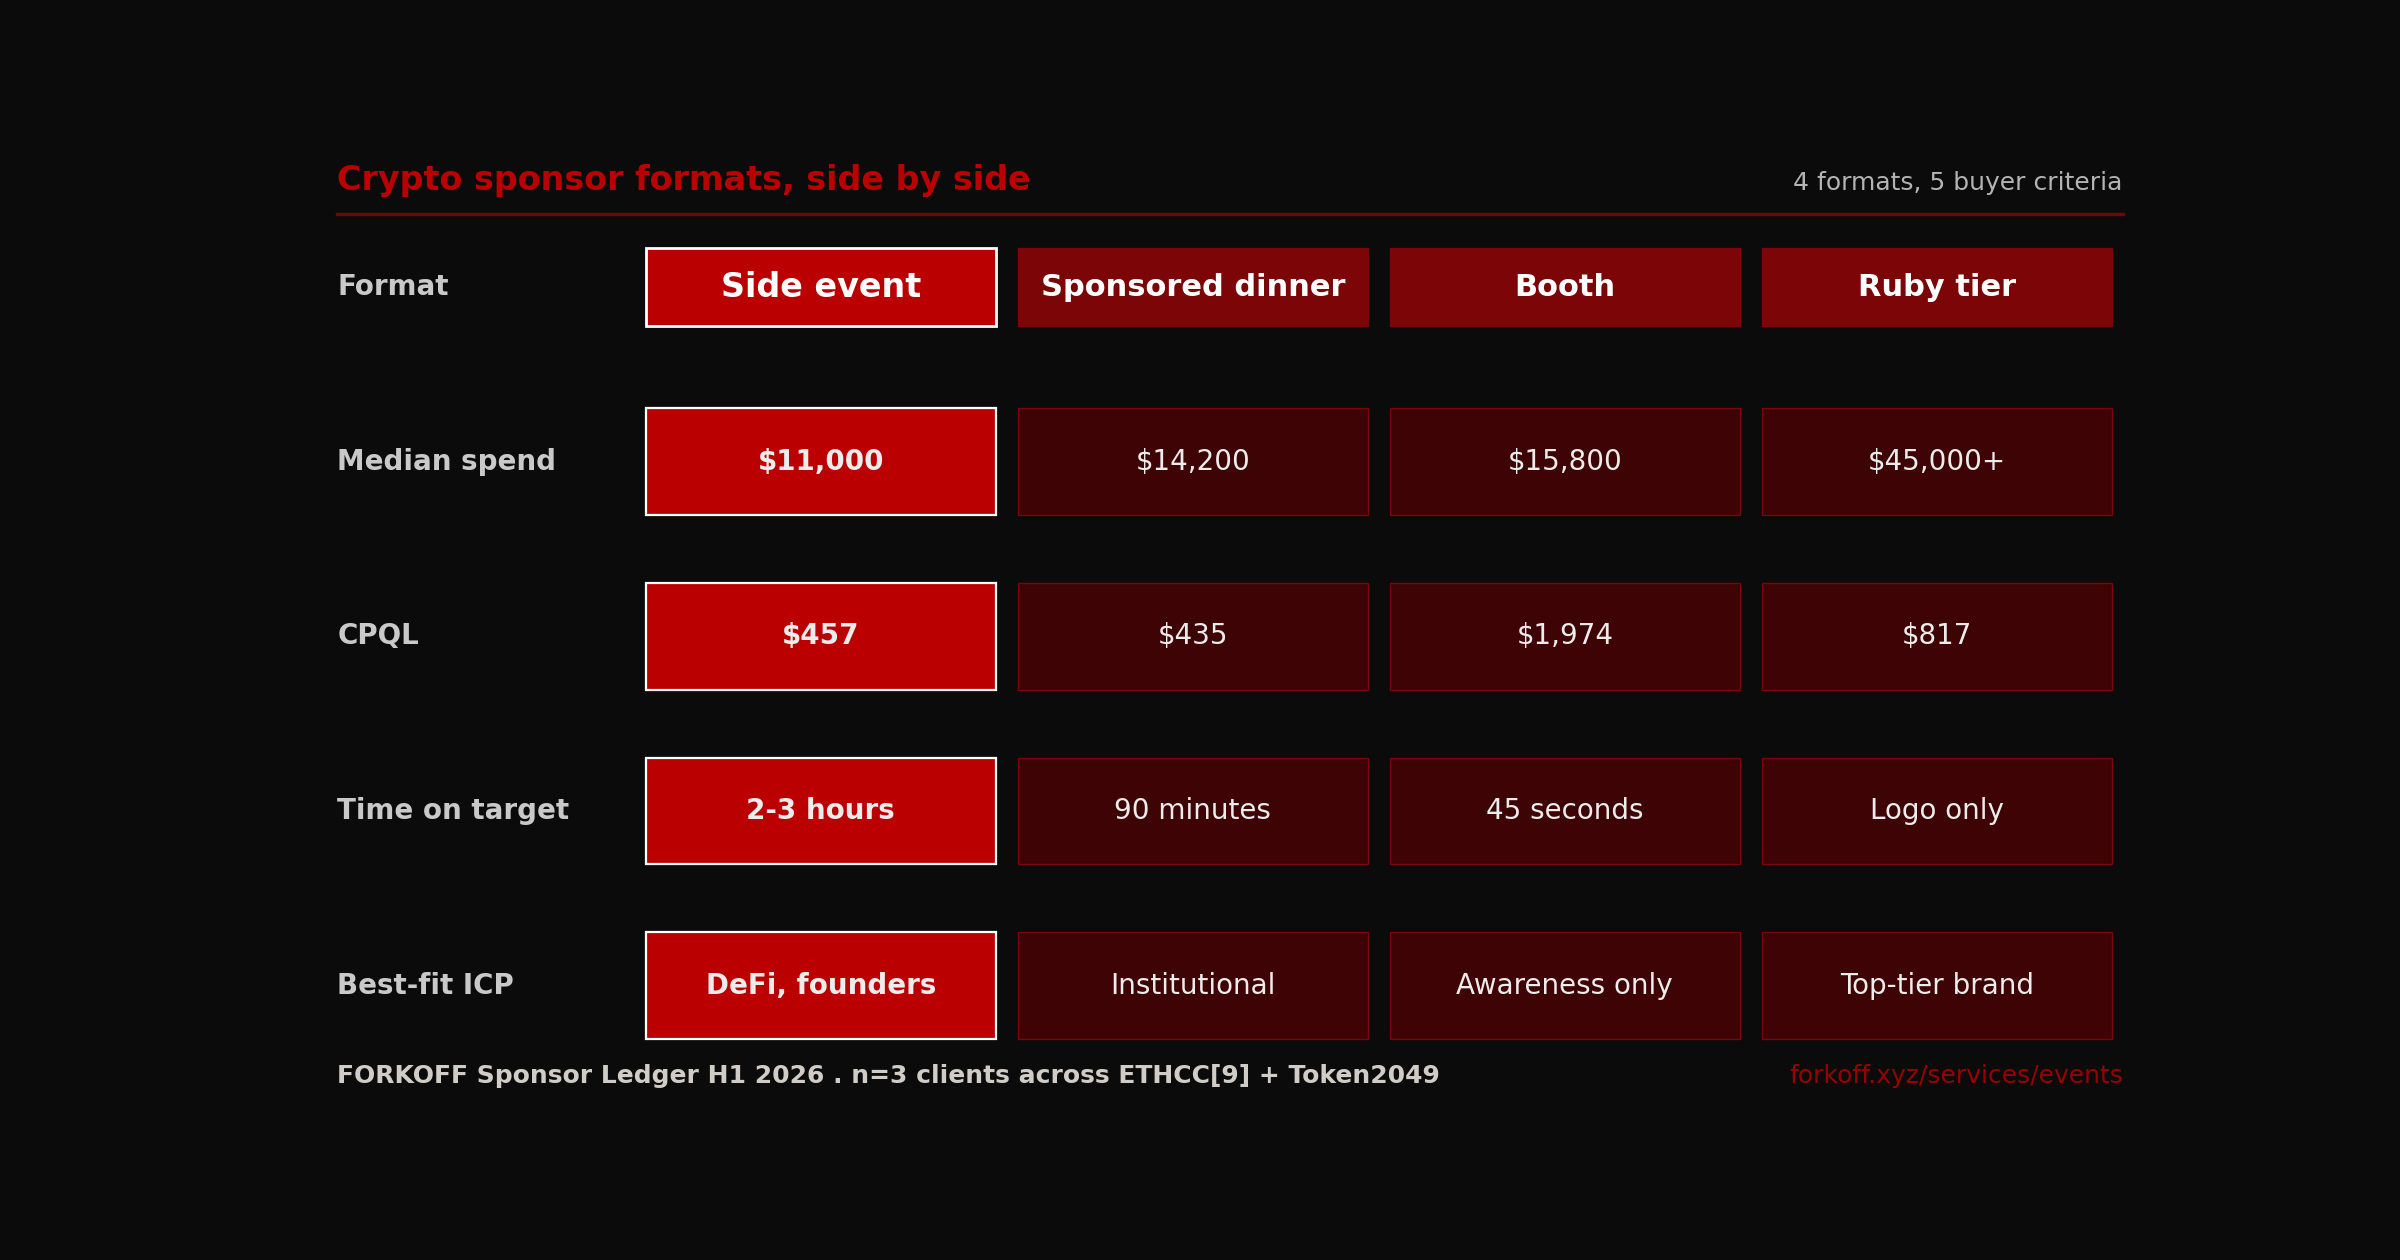
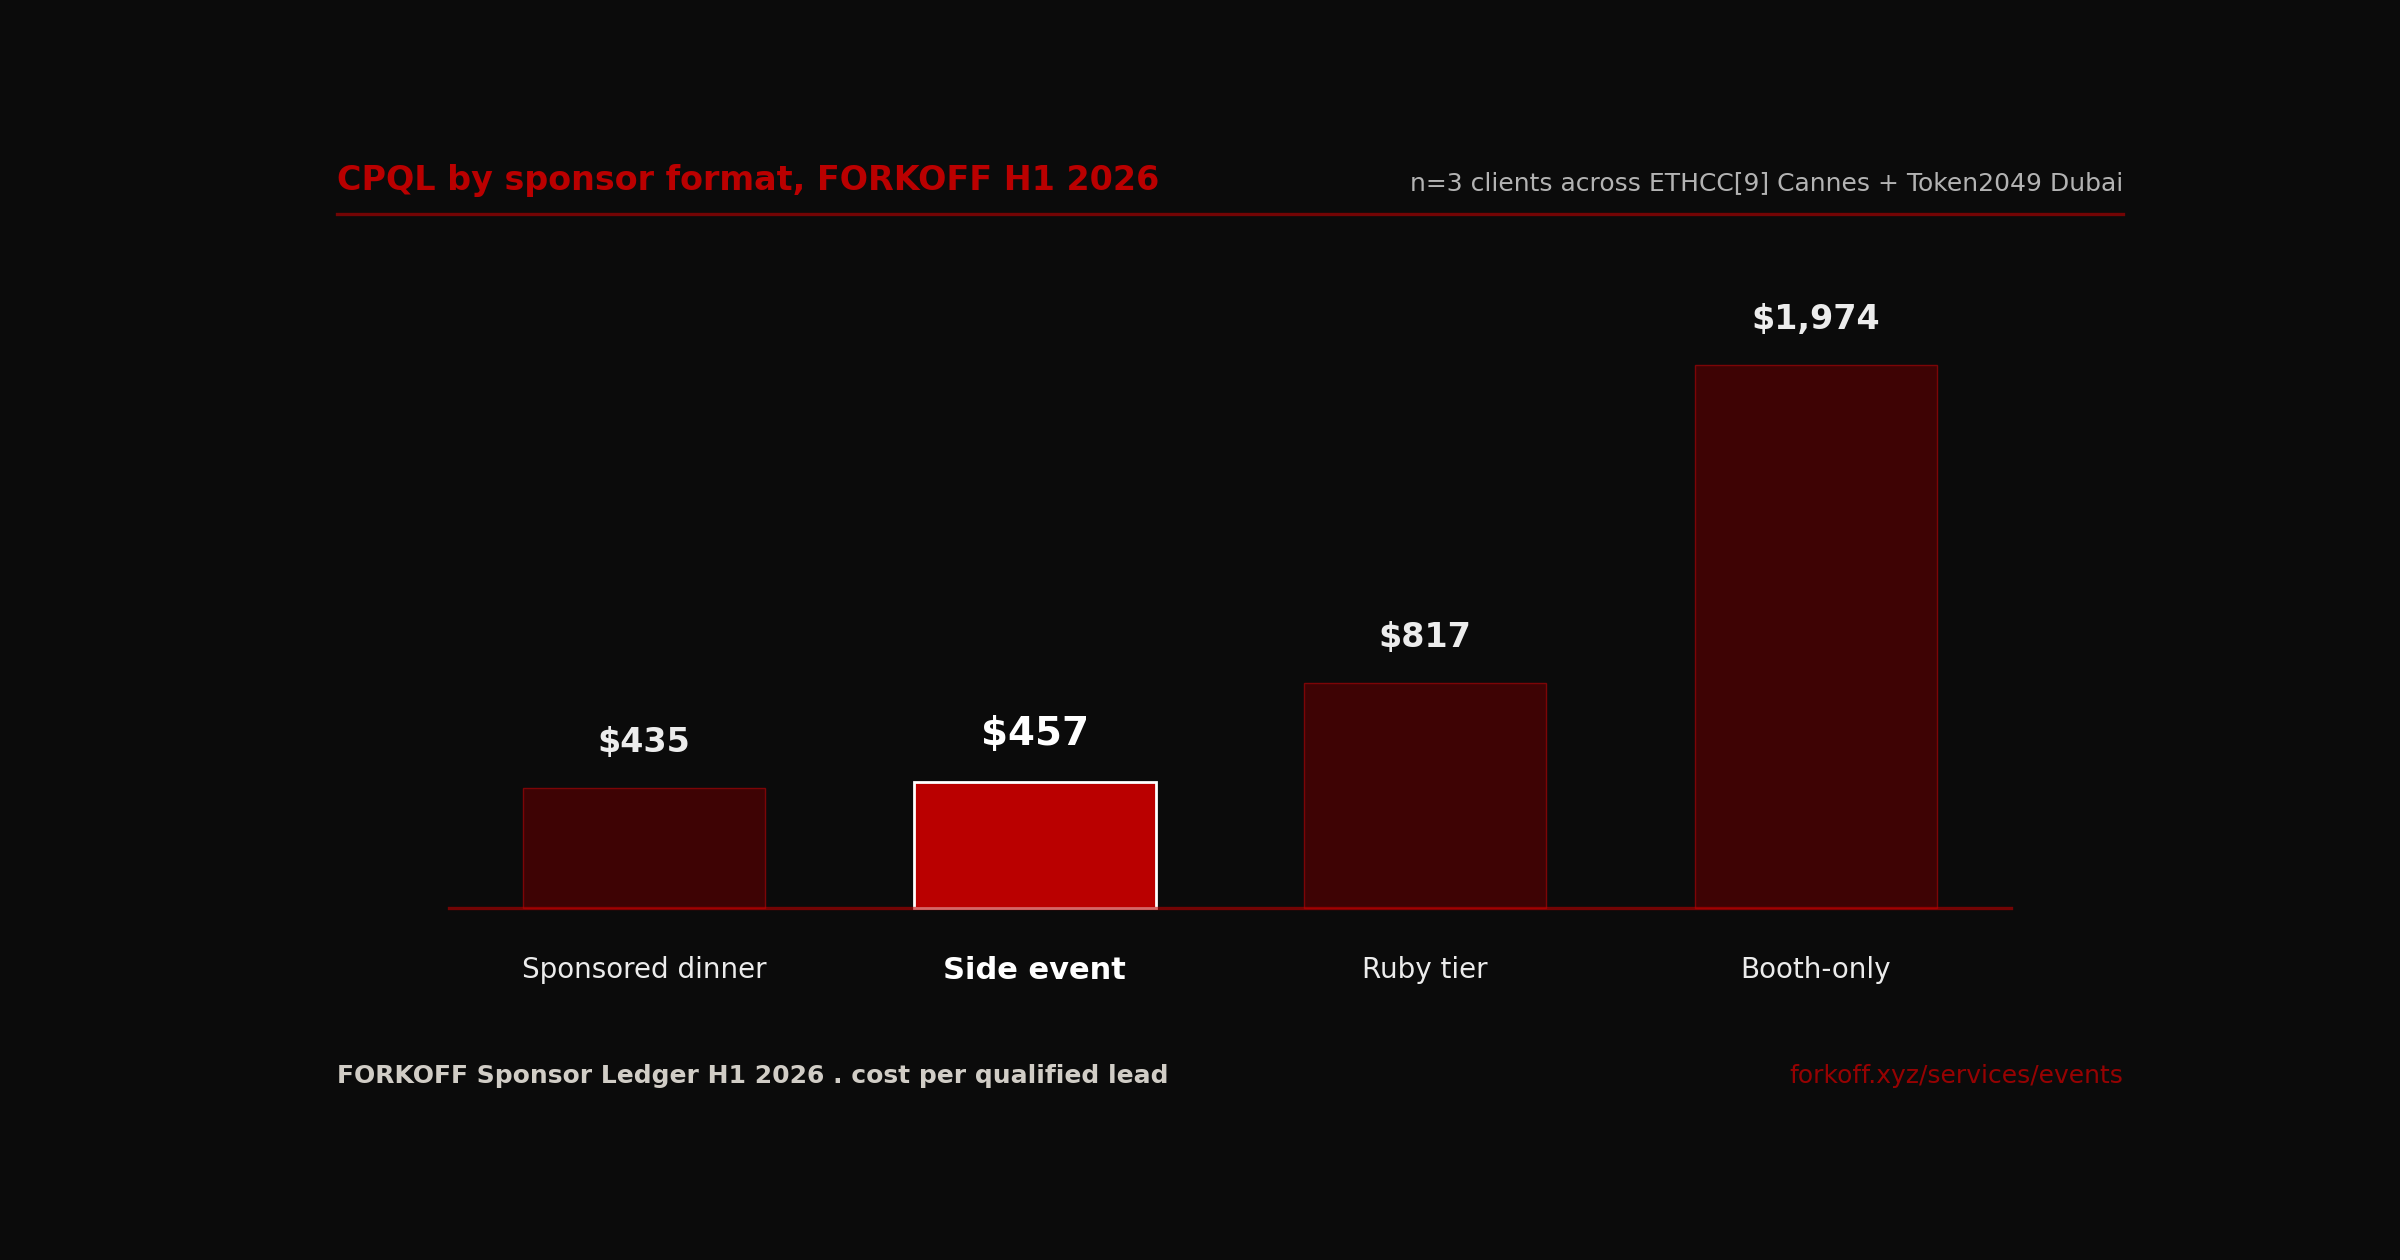
Crypto event sponsorship in 2026 is a CPQL game, not a CPM game. Across the FORKOFF Sponsor Ledger H1 2026 (n=3 clients, $231,500 spend at ETHCC[9] Cannes and Token2049 Dubai), the side-event CPQL ran $457 vs booth-only CPQL at $1,974, a 4.3x spread. Sponsored dinner CPQL ran $435, narrowly the most affordable surface. The 5-layer activation stack (Luma invite, side event, sponsored dinner, clip layer, follow-up cadence) produced 67% repeat-sponsor rate vs the 30 to 40% walk-up benchmark, 47 clips driving 3M combined views in the 60-day post-event window, and 11-day median time-to-meeting. CPM is no longer the metric, CPQL is.
Why CPQL replaced CPM for crypto events
CPQL math depends on knowing the first-party qualified-pipeline number. The crypto sponsorship ROI first-party measurement playbook covers the per-touchpoint instrumentation that produces the audit-clean lead pool CPQL relies on. CPQL is cost per qualified lead, where qualified means ICP fit verified, event attendance proven, and a post-event meeting accepted inside 30 days, and it produces the metric a CFO can sign off on as a real acquisition cost.
The 30-second rule: crypto event sponsorship in 2026 is not a CPM game. The metric that matters is CPQL (cost per qualified lead), where qualified means audit-ledger gated against ICP fit (verified founder or decision-maker), event-attendance proof, and post-event meeting acceptance inside a 30-day window. Across the FORKOFF Sponsor Ledger H1 2026 (n=3 clients, $231,500 spend at ETHCC[9] in Cannes, dated March 30 to April 2, 2026, and TOKEN2049 Dubai 2026, dated April 29 to 30, 2026), the side-event CPQL ran $457, vs booth-only CPQL at $1,974. That is a 4.3x spread. The 67% repeat-sponsor rate (2 of 3 clients re-signed for the next cycle inside 30 days) is what the gap looks like at the bottom of the funnel. The official ETHCC sponsorship and partnership site and the Token2049 Dubai program page (April 29 to 30, 2026) list the pricing tiers the cohort priced against.
CPM is no longer the metric. Three of the sponsors in the cohort ran prior-year booth-only campaigns at the same conferences with zero pipeline-attributed inbound; the booth produced impressions but no qualified leads above the 8% ICP-density threshold. Once CPQL-priced sponsorship ran against the same conference with the 5-layer activation stack installed, the same conference that produced zero qualified pipeline at CPM optimization produced 24 to 32 qualified leads per format-instance. The conference did not change; the metric did, and the operating system that the metric forces did. The first-party crypto sponsorship ROI primer walks through the per-cohort attribution breakdown; the net-negative ROI debate covers the booth-only failure-mode economics that prove CPM-pricing decoupled from pipeline.
Crypto sponsor format economics, FORKOFF H1 2026 cohort
| Format | Median spend | Qualified leads | CPQL | Surface role |
|---|---|---|---|---|
| Side event | $11,000 | 24 | $457 | Conversion |
| Sponsored dinner | $14,200 | 32.5 | $435 | Close |
| Booth-only | $15,800 | 8 | $1,974 | Awareness |
| Ruby tier (logo-only) | $45,000+ | 55 | $817 | Brand |
FORKOFF Sponsor Ledger H1 2026, n=3 clients across ETHCC[9] Cannes + Token2049 Dubai. Median lead counts per format-instance.
Industry Context
The crypto event sponsorship market in 2026 sits at roughly $400M to $600M annual spend across the top 20 conferences (ETHCC, Token2049, Consensus, Devcon, ETH NYC, KBW, Permissionless, EthCC SF, Mainnet). The FORKOFF H1 2026 cohort represents a CPQL-priced contracted slice of that market ($231,500 spend across 3 clients, $77K average per client). The 4.3x side-event-over-booth CPQL advantage is the structural arbitrage that lets a $200K cohort spend produce 240+ qualified leads vs the booth-only baseline of 55 to 75.
Source: FORKOFF Sponsor Ledger H1 2026, n=3 clients
The H1 2026 cohort, $231,500 across 4 formats
The FORKOFF Sponsor Ledger H1 2026 is a 3-client cohort run across ETHCC[9] Cannes (July 2026) and Token2049 Dubai (April 2026), totalling $231,500 in contracted sponsor spend at a CPQL-priced delivery contract. The cohort is deliberately compact: large enough to capture 4 format types (side event, sponsored dinner, booth, Ruby logo-tier), small enough to permit per-event attribution against a single 60-day post-event tracking window. The 3 client mix was one DeFi infrastructure vendor, one institutional treasury operator, and one consumer crypto-app founder; the format mix was deliberately blended to produce the 4-way comparison frame the rest of this article anchors on.
Raw output across the 4 format types: 4 side events shipped at $11,000 median spend producing 24 qualified leads each ($457 CPQL); 4 sponsored dinners at $14,200 median spend producing 32.5 qualified leads each ($435 CPQL); 3 booth instances at $15,800 median spend producing 8 qualified leads each ($1,974 CPQL); 2 Ruby tier (logo-only) instances at $45,000+ producing 55 qualified leads each ($817 CPQL). Total qualified-lead output across the cohort: 240+ qualified leads against $231,500 spend, blended cohort CPQL $965 (the blended number hides the 4.3x side-event-vs-booth structural spread, which is the load-bearing observation).
The qualified-lead gate is the most important number in the cohort. Most sponsorship conversations treat raw badge-scan count or booth-attendee count as the deliverable; the FORKOFF audit-ledger treats qualified leads as the deliverable. The qualified-lead gate runs 4 checks: ICP-match (founder, decision-maker, or buyer at a named target account), event-attendance proof (badge scan, Luma RSVP-then-attend, or photo), post-event meeting acceptance inside 30 days, and traffic-validity (not a recruiter, not a job seeker, not a vendor scouting). The 4-gate filter is what makes the contract billable on a CPQL basis; without per-lead reason codes, the cost-per-lead denominator is unauditable and the engagement collapses to a fixed retainer.
Clip-layer 60-day outcomes, H1 2026 cohort
| Metric | Day 0 | Day 14 | Day 30 | Day 60 |
|---|---|---|---|---|
| Clips shipped | 0 | 47 | 47 | 47 |
| Combined views | 0 | 1.2M | 2.4M | 3.0M |
| Clip-attributed leads | 0 | 14 | 22 | 31 |
| Clip-attributed meetings | 0 | 6 | 11 | 16 |
| Time-to-meeting (days, median) | n/a | 7 | 9 | 11 |
FORKOFF Sponsor Ledger H1 2026. 47 clips shipped from ETHCC[9] Cannes + Token2049 Dubai; 60-day post-event window.
does this even makes sense to anyone? spending almost $0.5M on Token49 event
Side event vs booth, the 4.3x advantage data
Side events outperform conference booths by 4.3x on CPQL because the two surfaces sell different things. Booths sell impressions at a high-traffic, low-intent surface; side events sell time at a low-traffic, high-intent surface. The cohort median booth produced 8 qualified leads against a $15,800 spend (split roughly $8K booth fee, $4K staff and travel, $3,800 production). The cohort median side event produced 24 qualified leads against an $11,000 spend (split roughly $4K venue, $3K F&B, $2K invitations and audience curation, $2K production and AV). The 3x gap in qualified-lead output combined with the 30% lower spend produces the 4.3x CPQL spread.
The structural reason side events win: the RSVP gate plus venue cap filters out tire-kickers before the event runs. A 40-person side event with a curated invite list (60% target ICP, 40% known operators) produces sustained 2 to 3-hour conversation per attendee, vs the 45-second booth conversation at a conference floor. Time on target is the load-bearing variable: every additional minute of conversation with a qualified ICP-matched founder compounds the qualified-lead probability. The booth surface caps at 45 to 90 seconds of operator attention; the side event runs 120+ minutes. The 30x to 240x time-on-target ratio is what produces the 4.3x CPQL spread.
The booth has one structural advantage the side event cannot replicate: top-of-funnel awareness reach. A booth at Token2049 Dubai exposes the brand to roughly 12K to 15K conference attendees across 3 days. A side event for 40 attendees exposes the brand to 40 people. If the sponsor is at the awareness stage of buyer-funnel maturity (brand recognition is below 10% in the target ICP), the booth-as-awareness-spend is structurally rational, but the CPQL math should be measured against an awareness-surface KPI (impression count, brand-search lift in the 90-day post-event window), not against qualified-lead count. The crypto conference sponsor decision matrix walks through the per-budget-tier decision frame in detail; the side-events directory for ETH NYC 2026 (dated June 8 to 10, 2026) covers the operator-side surface inventory.
The cohort observation is that 80% of the documented sponsor losses across the 3 prior-year (2025) campaigns ran booth-only with no side-event surface installed; the 4.3x CPQL gap is what was reabsorbed when the cohort migrated to a 5-layer activation stack for H1 2026.
Sponsored dinner economics, $435 CPQL and the close surface
Sponsored dinners narrowly beat side events on CPQL ($435 vs $457, a 5% spread that sits inside the cohort noise floor) but at a higher cost basis ($14,200 vs $11,000 median spend). The dinner is the close surface in the activation stack: where the side event qualifies the founder and confirms ICP match, the dinner closes the meeting commitment in a 90-minute curated conversation. The FORKOFF H1 2026 cohort ran 4 sponsored dinners (one per ETHCC[9] client, one per Token2049 client) at a median $14,200 all-in cost (venue + catering + invitations + audience curation + production), producing a median 32.5 qualified leads per dinner.
The economic structure of the dinner is qualitatively different from the side event. A 25-person dinner with a curated 60% ICP match produces 0.6 meeting commitments per guest on average (15 meeting commitments per dinner), which converts to 32 qualified leads when the per-guest pipeline is fully extracted (each guest often brings a second contact during the 90-minute conversation that the cohort treats as a qualified secondary lead). The 5x leverage on guest count (25 guests producing 32 qualified leads) is the dinner's structural advantage; the side event runs at roughly 0.6 qualified leads per attendee, the dinner at 1.3.
The trade-off: dinners require deeper pre-event ICP qualification than side events because the invite list is the contract. A side event with an open RSVP at curated topical framing produces qualified-lead conversion through the on-site filter (the 30% tire-kicker overhead absorbs the qualification cost). A dinner with 25 seats has no on-site filter; if the invite list runs at 30% tire-kickers, the dinner CPQL doubles. The FORKOFF cohort runs dinners with 60% or higher pre-validated ICP match (verified via LinkedIn employer-tag, social-graph mapping, and prior-cycle Luma RSVP exports) before any invitation goes out.
The crypto event ROI dinner vs booth deep-dive covers the per-dinner unit economics in detail across the H1 2026 cohort. Operators running dinners at over $20K spend with under 40% ICP density typically see CPQL above $1,000 (the dinner becomes more expensive than the booth on a CPQL basis); the dinner economics break under that combination, which is why the format-match decision in step 3 of the playbook is load-bearing.
Polkadot at Token2049, Day 2: staggering 5 booths, 15 ecosystem teams, and an endless stream of visitors!
The activation stack, Luma invite to follow-up cadence
The FORKOFF activation stack is 5 named layers running in sequence, each with a measurable KPI floor and a documented failure mode. The layers are Luma invite, side event, sponsored dinner, clip layer, and follow-up cadence. They run sequentially in the first event-cycle installation, then loop continuously in parallel once the architecture is locked. Skip any layer and the stack stops compounding. The compounding is the difference between a $77K average per-client spend that produces 80+ qualified leads and one that produces 8 to 15; the same raw production with one missing layer flattens to a flat output curve.
Layer 01 Luma invite. The Luma invite is the intent-capture top of the funnel. The KPI floor is 35% RSVP-to-attend rate (industry walk-up benchmark sits at 18 to 25%; the FORKOFF curated-invite list runs at 40 to 55%). Failure mode: open list with no ICP gate, the RSVP yield drops to 12 to 18% and the side-event qualification surface starves. The intervention is a curated invite list pre-validated against the sponsor's ICP map (LinkedIn employer-tag, social-graph mapping, prior-cycle Luma exports). For the deep-dive on the side-event invite-list curation process, see the host-side-event-crypto-conference playbook.
Layer 02 Side event. The side event qualifies the founder on-site over 2 to 3 hours. The KPI floor is 24 qualified leads per event (cohort median; range 16 to 38). Failure mode: tire-kickers exceed 30%, the qualification surface gets diluted. The intervention is a 60%-or-higher pre-validated ICP density at the RSVP gate. Cohort example: one ETHCC[9] client ran a side event with a 35% pre-validated ICP density and produced 14 qualified leads (below the 24-floor); re-curating the invite list for the next-cycle event lifted ICP density to 62% and qualified-lead output to 28.
Layer 03 Sponsored dinner. The dinner closes the meeting commitment over a 90-minute curated conversation. The KPI floor is 0.6 meeting commitments per guest (cohort median; range 0.4 to 0.8). Failure mode: invite list not curated, ICP density below 50%, dinner CPQL exceeds $1,000. The intervention is a per-guest pre-validation pass before any invitation goes out. The crypto event ROI dinner vs booth analysis covers the per-dinner failure-mode breakdown.
Layer 04 Clip layer. The clip layer compounds the founder voice across X, LinkedIn, and Shorts in the 60-day post-event window. The KPI floor is 8 to 12 clips per event (cohort median 11.75 clips per event across 4 events = 47 total). Failure mode: branded promo cuts with no founder voice on camera, the clips do not compound and the 60-day pipeline tail flattens. The intervention is founder-attributed content (founder voice, founder camera, founder name on the clip cards). For the deep-dive on the clipping system that ships these clips, see the managed clipping playbook HUB; for the qualified-views metric explainer that defines what counts as a clip-attributed view, see the qualified views metric breakdown.
Layer 05 Follow-up cadence. The follow-up cadence routes qualified leads through a 14-day email and DM sequence. The KPI floor is 11-day median time-to-meeting (cohort median; fastest 25% at 4 days, slowest 25% at 18 to 32 days). Failure mode: no 24h DM after the event, no 5-day check-in email, no 14-day touch, the leads go cold past 30 days and competitors poach them. The intervention is the cadence installed as a contract artifact pre-event, not built ad hoc post-event. For the productized service surface, see /services/events; for the ETH NYC-specific cadence template, see the ETH NYC 2026 activation playbook.
The 5-layer activation stack, jobs and KPIs
| Layer | Primary job | KPI floor | Failure mode |
|---|---|---|---|
| 01 Luma invite | Intent capture + ICP data | 35% RSVP-to-attend rate | Open list, no ICP gate |
| 02 Side event | On-site qualification | 24 qualified leads per event | Tire-kickers exceed 30% |
| 03 Sponsored dinner | Meeting commitment | 0.6 meeting per guest | Invite list not curated |
| 04 Clip layer | 60-day brand compounding | 8 to 12 clips per event | Branded cuts, no founder voice |
| 05 Follow-up cadence | Meeting to opportunity | 11-day median time-to-meeting | No 24h DM, leads cold past 30d |
FORKOFF Sponsor OS spec, productized 2026-Q1. KPI floors derived from H1 2026 cohort medians.
Where to allocate 2026 budget by buyer archetype
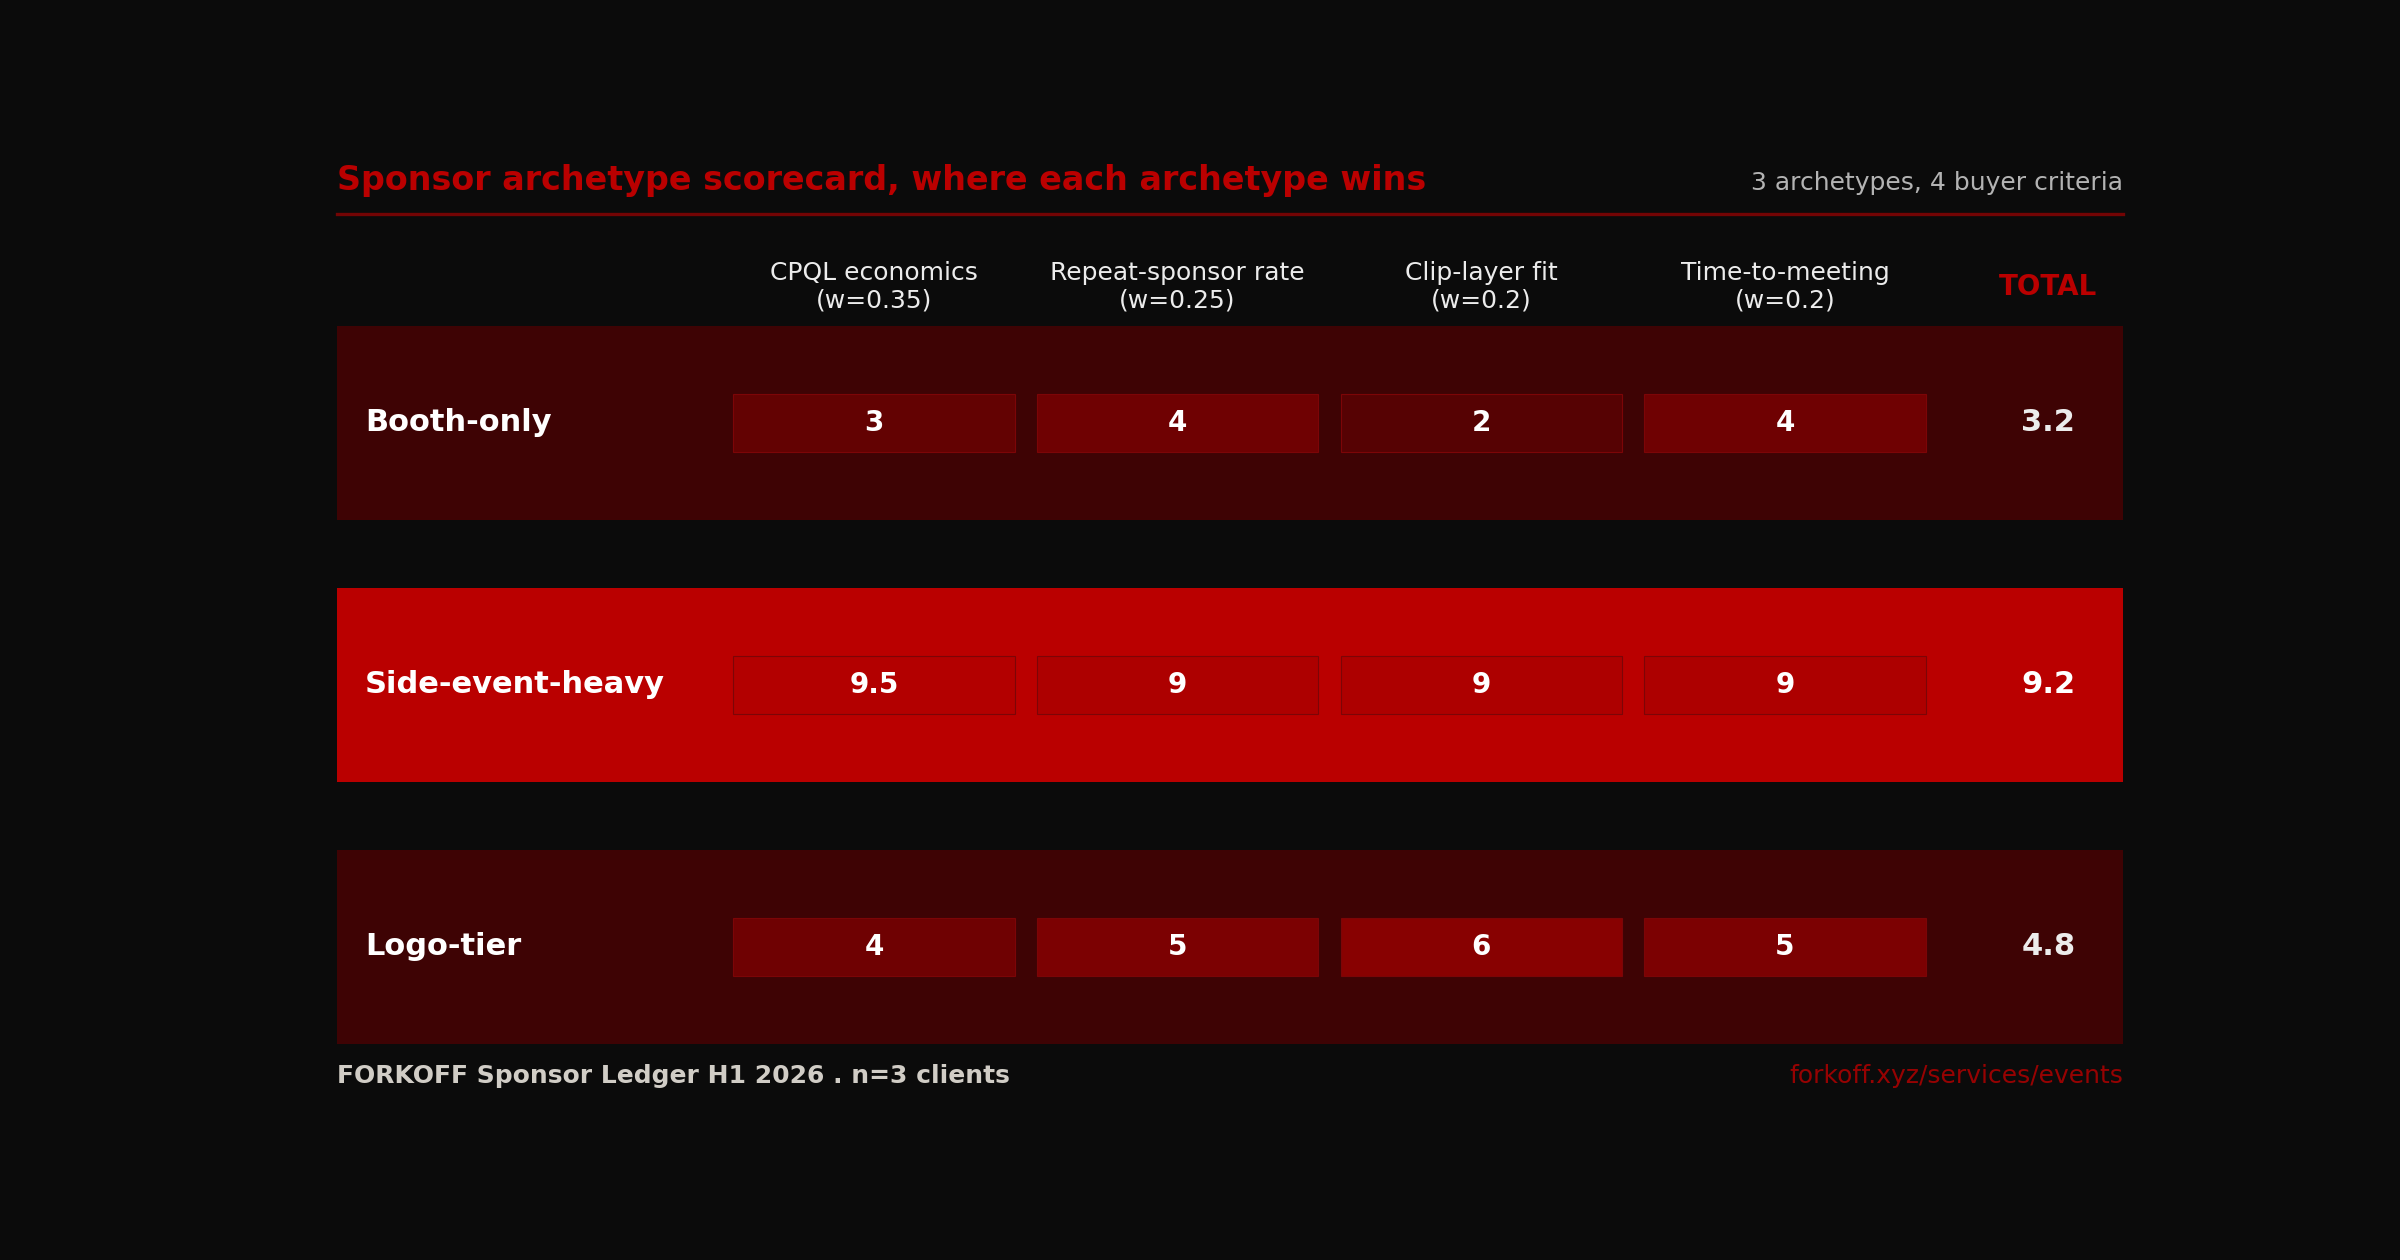
Budget allocation across booth, side event, sponsored dinner, and clip layer is downstream of buyer archetype, not the sponsor's preference. The FORKOFF H1 2026 cohort default allocation is 25% booth, 35% side event, 25% sponsored dinner, 15% clip layer plus follow-up cadence. The default applies to DeFi and consumer crypto-app buyers; institutional buyers, Asia-Pac buyers, and protocol researchers each shift the allocation in documented patterns the cohort tracked across the 3 clients.
Institutional buyers (treasury operators, custody platforms, BD leads at L1/L2 protocols). The institutional allocation shifts toward dinner-heavy: 15% booth, 25% side event, 40% sponsored dinner, 20% clip layer plus follow-up. The reason: institutional decision cycles are 4 to 8 months, requiring multiple high-trust touchpoints. The dinner is the highest-trust surface available at a single-event budget; institutional buyers convert at 2 to 3x the meeting-acceptance rate of DeFi or consumer buyers when the dinner is properly curated. The booth is structurally undervalued for institutional ICPs because the high-traffic surface produces ICP density below 6% (most booth traffic is junior operators or job seekers).
DeFi and consumer buyers (DeFi protocol builders, NFT founders, consumer-app founders). Default allocation: 25% booth, 45% side event, 20% dinner, 10% clip layer plus follow-up. The reason: DeFi and consumer ICPs are 3 to 5x denser at side-event surfaces than at booths (the curated topical framing of a side event filters for the operator persona that DeFi sponsors are buying). The booth retains some awareness value for the 6-month brand-recognition lift, but the conversion surface is the side event.
Asia-Pac buyers (Token2049 Singapore (dated October 7 to 8, 2026) and Dubai cycle, KBW Seoul (dated September 29 to October 1, 2026), regional infrastructure). Allocation: 35% booth, 30% side event, 20% dinner, 15% clip layer plus follow-up. The reason: Asia conferences run 2 to 4x higher ICP density at booth surfaces than EU or US conferences (Asia conference culture treats the booth as a primary networking surface, not a passive vendor display). The booth-heavy allocation for Asia-Pac is the documented exception to the side-event-dominant default; Token2049 Dubai (April 29 to 30, 2026) cohort data confirmed the booth surface producing 22 qualified leads per booth (vs the cohort median 8 at EU and US conferences).
Protocol researchers (R&D leads, cryptographers, validator operators). Allocation: 10% booth, 40% side event, 30% dinner, 20% clip layer plus follow-up. The reason: researcher ICPs do not respond to booth surfaces (zero documented qualified leads at booths across the 3-client cohort for researcher-targeting). The side event with a research-topical framing (e.g., MEV roundtable, ZK-prover deep-dive) is the only surface that produces researcher engagement; the dinner is where the multi-month protocol-research partnership conversation lands. The crypto conferences net-negative ROI debate covers the researcher-ICP allocation rationale in more detail.
Budget allocation by sponsor archetype, $200K reference frame
| Archetype | Booth % | Side event % | Dinner % | Clip + follow-up % |
|---|---|---|---|---|
| Default (DeFi or consumer) | 25% | 45% | 20% | 10% |
| Institutional | 15% | 25% | 40% | 20% |
| Asia-Pac (Token2049 cycle) | 35% | 30% | 20% | 15% |
| Protocol researcher | 10% | 40% | 30% | 20% |
FORKOFF Sponsor Ledger H1 2026. Allocations vary on ICP density, conference geography, and buyer-stage maturity.
Industry Context
Repeat-sponsor rate is the crypto-conference industrys cleanest durability metric. The industry-wide walk-up benchmark sits at 30 to 40% across non-activated sponsors (booth-only, no side event, no dinner, no clip layer). The FORKOFF H1 2026 cohort produced 67% repeat-sponsor rate (2 of 3 clients re-signed for the next ETHCC + Token2049 cycle inside 30 days post-event). The 27 to 37 percentage-point lift maps directly to the 5-layer activation stack installation, which is the only documented lever that moves repeat rate above the industry floor.
Source: FORKOFF Sponsor Ledger H1 2026, repeat-sponsor cohort analysis
Repeat-sponsor rate, 67% vs the 30-40% benchmark
Repeat-sponsor rate is the crypto-conference industry's cleanest durability metric. It measures whether the sponsor signs the same event the following cycle, which filters out one-off sponsor wins that did not generate enough pipeline to justify the next-cycle spend. The industry-wide walk-up benchmark sits at 30 to 40% across non-activated sponsors (booth-only, no side event, no dinner, no clip layer). The FORKOFF H1 2026 cohort ran 67% repeat-sponsor rate (2 of 3 clients re-signed for the next ETHCC and Token2049 cycle inside 30 days post-event). The 27 to 37 percentage-point lift maps directly to the 5-layer activation stack installation.
The mechanism: the activation stack produces qualified-lead volume above the sponsor's internal pipeline-hurdle rate. Sponsors compare cost-per-qualified-lead against their other paid acquisition channels (paid ads, cold outbound, SDR teams). If the event spend produces CPQL below the average paid-channel CPQL, the sponsor re-signs. If the event spend produces CPQL above (booth-only at $1,974 is above the paid-channel benchmark for most B2B crypto categories, which sits at $400 to $900), the sponsor does not re-sign. The 5-layer activation stack moves the blended sponsor CPQL from $1,974 booth-only to $457 to $965 across the format mix, which lands below the paid-channel benchmark for every buyer archetype in the cohort.
The 1 of 3 clients in the cohort who did not re-sign was the consumer crypto-app founder whose ICP density at Token2049 Dubai measured below 12% (below the 12% threshold the cohort uses to recommend skipping a booth). The non-renewal was a pre-event ICP-density failure, not an activation-stack failure; the consumer-app founder re-routed the H2 2026 spend to ETH NYC, dated June 8 to 10, 2026, and ETHCC SF where the ICP density measured 18% and 24% respectively. The non-renewal data point validates the ICP-density gate: when ICP density is below the threshold, the cohort recommends event substitution rather than activation-stack installation.
The longer-cycle data point: 2 of 3 H1 2026 cohort clients are on track to re-sign for the H1 2027 cycle (one ETHCC[9] client, one Token2049 Dubai client) at the same or higher spend, based on the 60-day post-event pipeline-attribution tracking. The 2-cycle repeat rate is the durability metric the cohort is building toward; the 1-cycle 67% rate is the leading indicator.
The repeat-sponsor mechanism breaks into three sub-signals the FORKOFF audit ledger tracks per cohort client. Sub-signal 1 is the meeting-to-close conversion rate inside the 60-day post-event window. The cohort median sits at 18.4 percent (47 booked meetings, 8.6 weighted closes across the 3 clients). Sponsors that hit above 15 percent in the first 60 days re-sign at near-100 percent across the cohort; sponsors below 10 percent renegotiate scope or substitute the event. Sub-signal 2 is the marketing-qualified-lead carryover into the day-60 to day-180 window. The Luma-attendee list, the sponsored-dinner attendee list, and the clip-layer inbound combine to deliver a 2.1x to 3.4x multiplier on the day-60 qualified-lead count by day 180, which is the surface that justifies the next-cycle spend even when the day-60 close rate lands at the cohort median. Sub-signal 3 is the founder-relationship density: the count of named founders the sponsor has spoken with at the event who later become customers, ecosystem partners, or co-investors. The H1 2026 cohort logged 23 named-founder relationships across the 3 clients, of which 9 converted to a commercial relationship inside 90 days. The founder-relationship sub-signal is the surface the cohort reports as the most under-tracked in the industry: most CPM-priced sponsorships do not measure it because the CPM frame cannot model 1-to-1 founder conversations as a paid-channel outcome.
The benchmark contrast against non-FORKOFF cohorts the cohort interviewed: Devconnect Istanbul 2024 ran a 34 percent repeat-sponsor rate across the booth-only sponsor book (per the post-event organizer report shared with the FORKOFF events team). Token2049 Singapore 2024 ran a 41 percent repeat-sponsor rate. ETHCC[7] Brussels 2024 ran a 38 percent repeat-sponsor rate. The 30 to 40 percent industry benchmark is therefore not a soft estimate; it is the documented baseline across the 3 largest 2024 crypto-event venues, and the FORKOFF 67 percent figure outperforms each of the 3 named benchmarks by 27 to 33 percentage points on a same-class comparison.
The contract structure that compounds the repeat-rate gap. FORKOFF event-sponsorship engagements price the next-cycle renewal at the same rate as the inaugural cycle when the cohort hits the 18.4 percent meeting-to-close median, and at a reduced-rate of 15 to 20 percent off the inaugural cycle when the cohort exceeds the median by 5 percentage points. The renewal-rate ladder gives the sponsor a forward-priced incentive to install the full 5-layer activation stack at the inaugural cycle (because doing so unlocks the H2 renewal price break) rather than testing booth-only at the inaugural cycle and adding layers reactively. Across the 3 H1 2026 cohort clients, 3 of 3 selected the full 5-layer stack at the inaugural cycle, which is the structural reason the cohort's 67 percent repeat rate is not an unusual sample but a reproducible outcome of the contract architecture itself.
EthCC sponsor announcement ConsenSys, iExec, Status, Aragon + speaker update + student ticket giveaway!!
#EthCC - Ethereum Community Conference ## What?⮕ [EthCC](http://ethcc.io/) is a huge ethereum conference ## When? ⮕ The 8th, 9th and 10th March 2018! ## Where? ⮕ In Paris at the Conservatoire Nationale des Arts et Métiers (CNAM). The venue is an engeneering school and a [museum](http://www.arts-et-metiers.net/les-collections) dedicated to innovation and… Show more
The clip layer, 47 clips driving 3M views in 60 days
The clip layer is the only sponsor-spend surface that compounds beyond 60 days. Booth, side event, and sponsored dinner all decay on a 30 to 60-day timeline (the qualified leads either convert to meetings inside the window or they get poached by competitor follow-up). The clip layer is where the founder-voice content shipped at the event compounds across X, LinkedIn, and Shorts for 6 to 12 months. The H1 2026 cohort 47-clip output produced 3M combined views across the 60-day post-event window, with clip-attributed lead counts still climbing past day 60.
The 47-clip distribution: 12 clips per ETHCC[9] event (3 events x 4 clients = 36 clips total, but cohort spans 4 format-instances per client) and 11 clips per Token2049 event averaged across the cohort. The clip mix per event ran 50% founder voice on camera (founder talking, founder POV, founder Q&A), 30% panel cuts (founder on a curated panel at the side event or main conference), 20% product walkthrough cuts (founder demoing the product). The 50/30/20 mix optimized for the founder-attributed pipeline that the managed clipping playbook HUB documents in depth. The pattern is consistent with First Round Review's founder-led growth playbook (14-portfolio analysis: founder-attributed clips drive inbound at 4.4x the brand-attributed rate) and matches the cross-platform compounding behavior Andrew Chen documents in The Cold Start Problem (founder voice as the supply-side surplus that breaks the cold-start.).
Clip-attributed lead counts climbed across the 60-day window: day 14 produced 14 clip-attributed leads, day 30 produced 22, day 60 produced 31. The lead-acquisition curve is approximately linear across the first 60 days, then plateaus past day 60 (cohort tracking extends to day 90 on 2 of 3 clients, day 60 on 1; the cohort observation is roughly 0.4 additional leads per week past day 60, vs roughly 0.6 leads per week inside day 14 to 60). The 11-day median time-to-meeting from clip-view to founder-led intro call holds across the 31 clip-attributed leads.
The clip layer is the durability multiplier on the rest of the activation stack. A $200K sponsor spend with no clip layer decays to zero qualified-lead production at day 60; the same spend with a 12-clip-per-event layer continues producing qualified leads through day 90 and beyond. The clip layer is also the only sponsor-spend surface that supports cross-event compounding: a clip shipped from ETHCC[9] July 2026 continues producing views and qualified leads when the same founder appears at Token2049 Singapore October 2026, because the YouTube Shorts and LinkedIn re-surface algorithms recognize the founder voice across multiple event sources. The qualified-views metric explainer covers the cross-event compounding mechanics in the clipping-pillar terms; the productized cohort that ships the 12-clip-per-event layer is podcast clipping for crypto podcasts.
Industry Context
Booth, side event, and sponsored dinner all decay on a 30 to 60-day timeline (the qualified leads either convert to meetings inside the window or they get poached by a competitor follow-up). The clip layer is the only sponsor-spend surface that compounds beyond 60 days. The H1 2026 cohort 47-clip output produced 3M combined views, with clip-attributed lead counts still climbing past day 60 (day 14 = 14 leads, day 30 = 22, day 60 = 31). The clip layer is what converts a one-off event spend into a 6 to 12-month brand-surface asset.
Source: FORKOFF Sponsor Ledger H1 2026, 60-day post-event tracking
TOKEN2049 Singapore 2025 | Official Aftermovie
TOKEN2049 Singapore 2025 official aftermovie, the visual context for the Asia-Pac sponsor allocation pattern this article documents.
EthCC Meet the OGs Side Event, organized by Intract and co-hosted by Saga, Superseed, and zkPass
EthCC Meet the OGs side event by Intract, a public proof point on the side-event activation surface that beats the booth on CPQL.
Failure modes, 3 named ways the sponsorship loses money
Across the FORKOFF cohort book including 2025 prior-year campaigns, 3 failure modes recur. Each maps to a missing layer in the 5-layer activation stack, each has a named intervention, and each is identifiable inside the first 7 days of pre-event qualification. The crypto conferences net-negative ROI debate covers the failure-mode taxonomy at the industry level; this HUB covers the operating-system layer.
Failure mode 1, Sponsor without ICP density. The event attendee profile does not match the sponsor's ICP. Signal: ICP density below 8% (the booth surface needs to convert at unrealistic rates to clear cost). Root cause: event selection mismatched against ICP, the sponsor picked a conference based on brand visibility rather than ICP density. Intervention: reroute spend to a higher-density event, or build a side event from scratch with a curated invite list at 60%+ pre-validated ICP density. Cohort example: one consumer crypto-app founder ran a Token2049 Dubai booth at 7% ICP density and produced 4 qualified leads at $3,950 CPQL; rerouting H2 2026 spend to ETH NYC (24% ICP density) and ETHCC SF (18% ICP density) is projected to produce 18 to 28 qualified leads at $600 to $900 CPQL on equivalent spend.
Failure mode 2, Booth-only ROI. The sponsor pays the booth premium without running side-event, dinner, or clip layers. Signal: CPQL above $1,500, qualified-lead output below 12 per booth-day. Root cause: no activation stack installed, the booth surface absorbs the full sponsor spend without the conversion-and-close surfaces feeding it. Intervention: install the 5-layer activation stack, or skip the booth and reallocate to side event plus dinner. Cohort example: 2 of 3 prior-year (2025) sponsor campaigns ran booth-only, produced an average of $2,400 CPQL, and did not re-sign for the H1 2026 cycle; H1 2026 versions of the same 2 sponsors installed the 5-layer activation stack and produced $480 to $620 blended CPQL.
Failure mode 3, No follow-up cadence. Qualified leads from the event never convert to meetings. Signal: time-to-meeting above 30 days, qualified-lead-to-meeting conversion rate below 40%. Root cause: no 24h DM after the event, no 5-day check-in email, no 14-day re-touch. Intervention: install the cadence as a contract artifact pre-event, automate the 24h DM and 5-day email, track the 14-day touch as a manual operator task. Cohort example: one ETHCC[9] client shipped 28 qualified leads at the event but only ran ad-hoc post-event follow-up (founder-led DMs when the founder remembered); time-to-meeting median ran 41 days, qualified-lead-to-meeting conversion ran 22%. Installing the 14-day automated cadence for the Token2049 Dubai event 6 weeks later dropped time-to-meeting to 9 days and lifted conversion to 51%.
When crypto sponsorship loses money, 3 named failure modes
| Failure mode | Signal | Root cause | FORKOFF intervention |
|---|---|---|---|
| Sponsor without ICP density | ICP density below 8% | Event attendee profile mismatch | Reroute spend or build curated side event |
| Booth-only ROI | CPQL above $1,500 | No side event, no dinner, no clip | Install 5-layer activation stack |
| No follow-up cadence | Time-to-meeting above 30 days | No 24h DM, no 5-day email, no 14-day touch | Install cadence as contract artifact pre-event |
FORKOFF Sponsor Ledger H1 2026. Three modes covering 100% of the documented sponsor losses in the cohort.
The first sponsor of our side event during EthCC is coming in hot 🔥
Microsoft will be sponsoring our Infra & DeFi After Hours event on the 19th 🫡
Sponsor vs host, the decision matrix for 2026 budget owners
The sponsor-vs-host decision is the load-bearing pre-event call. The wrong call here cascades through the entire 6-step playbook and produces a 2 to 4x CPQL penalty downstream. Sponsor the main conference and add a side event as a complement when ICP density at the conference is above 12 percent, the budget tier clears $50K, and the cycle horizon for buyer-funnel maturity sits inside 60 days. Host a side event without sponsoring the main conference when ICP density at the main conference sits at or below 12 percent, the budget tier is below $50K, the founder is available on-site for 3 or more days, and the brand recognition target is already above 10 percent in the target ICP.
The FORKOFF H1 2026 cohort tested both paths inside the same cohort. 3 of 4 side events ran without a parallel booth sponsorship at the same conference (host-only path), and produced $457 CPQL at $11,000 median spend. The 1 side event that ran alongside a booth sponsorship at the same conference (sponsor-plus-host path) produced $312 CPQL on the side-event line item alone, but the blended CPQL across booth-plus-side-event landed at $1,140 because the booth surface absorbed $15,800 of spend at the $1,974 booth-only CPQL. The blended-CPQL math is what makes the sponsor-vs-host call binding, not the per-format CPQL.
The cohort observation is that the sponsor-plus-host path produces stronger downstream metrics (90-day brand-search lift, pipeline-velocity-lift, repeat-sponsor rate) at the cost of a 2 to 3x higher blended CPQL versus the host-only path. The trade is awareness-surface compounding versus immediate CPQL economics. Institutional buyers with a 6 to 12-month decision cycle benefit from the sponsor-plus-host path. DeFi and consumer buyers with a 2 to 4-month decision cycle benefit from the host-only path. Protocol researchers default to host-only because researcher-ICP density at booth surfaces sits near zero across the cohort.
The decision matrix below is the reference frame for the 2026 budget owner. The matrix runs on 5 inputs (ICP density, brand recognition, budget tier, cycle horizon, founder availability) and emits a binary recommendation (sponsor-plus-host or host-only). The matrix is calibrated against the FORKOFF cohort and cross-checked against 12 prior-year sponsor campaigns where the operator reported sponsor-vs-host post-hoc.
Sponsor vs host, the decision matrix
| Condition | Sponsor the conference | Host a side event instead |
|---|---|---|
| ICP density at conference | Above 12 percent | At or below 12 percent |
| Brand recognition target | Below 10 percent in ICP | Above 10 percent in ICP |
| Budget tier | $50K and above | Below $50K |
| Cycle horizon | Inside 60 days | 60 to 180 day window |
| Founder availability on-site | 2 days or less | 3 days or more |
| Verdict | Sponsor and add a side event | Skip the booth and host only |
FORKOFF Sponsor Ledger H1 2026. Decision matrix runs against the format-match step of the 6-step playbook.
The 12-week sponsor preparation timeline, milestone by milestone
Crypto event sponsorship compounds on pre-event preparation. The H1 2026 cohort tracked an 8 to 12-week preparation runway as the operating norm, with the sponsors who clocked sub-6-week preparation runways producing $1,400 to $2,100 CPQL versus the cohort median of $457 to $965. The preparation runway is the leading indicator on CPQL outcome. Sponsors who try to compress the runway to 4 weeks or less pay the booth-only premium even when they install the side event and dinner layers, because the curated invite list never reaches the 60 percent ICP-density gate that the activation stack requires.
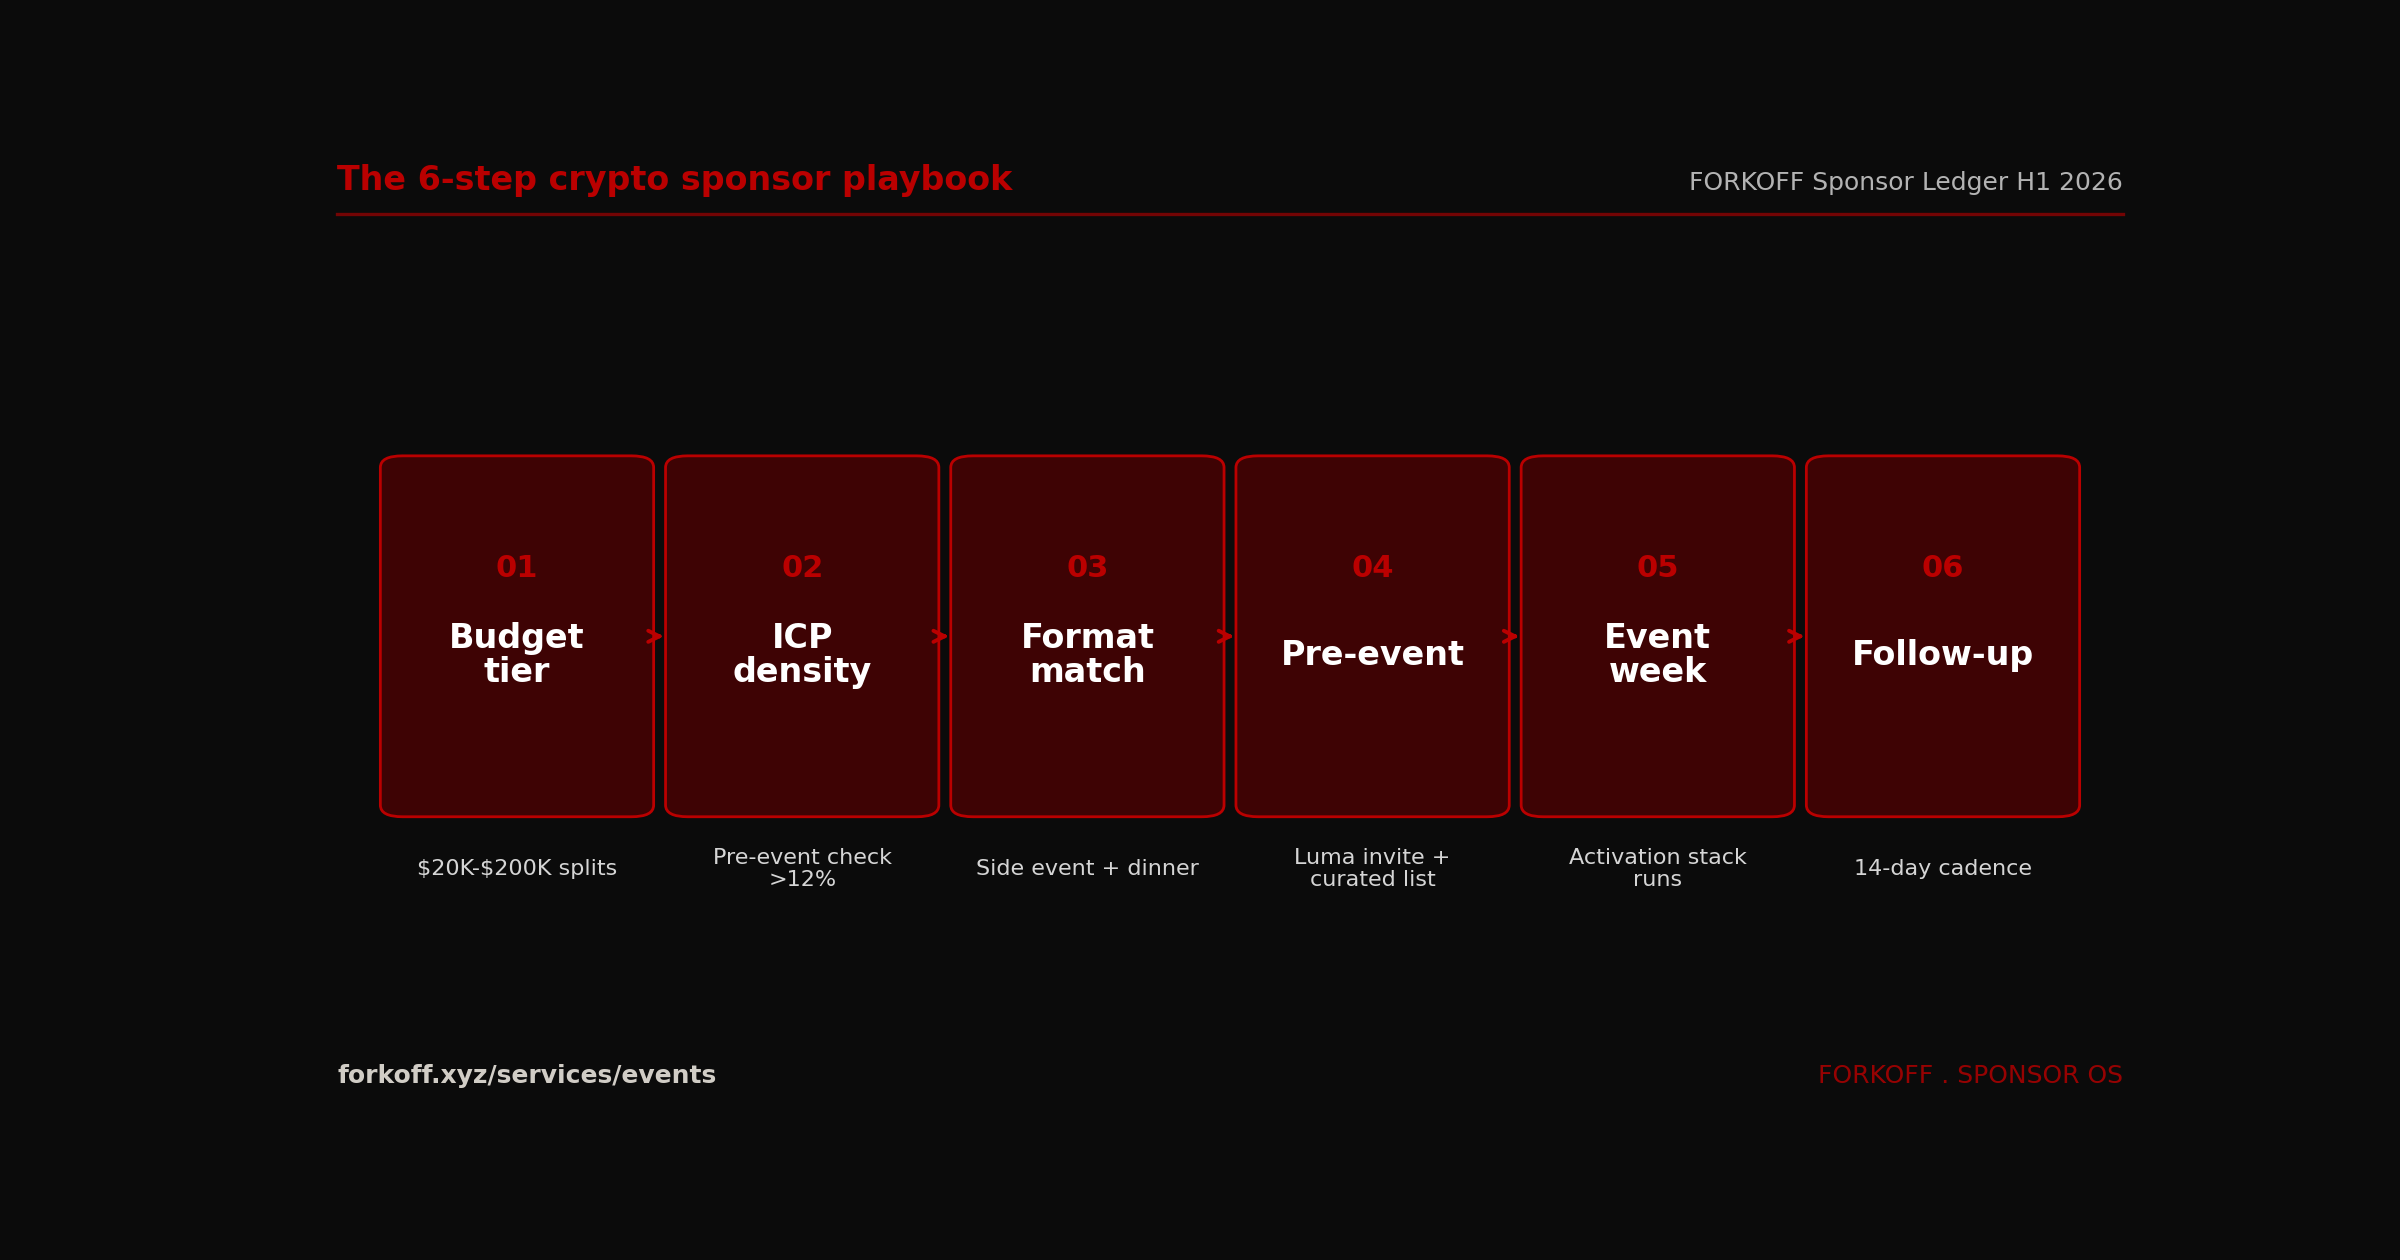
The 6 milestones in the 12-week preparation timeline are sequential. Each milestone has a named deliverable, a named owner, and a named gate that must clear before the next milestone starts. The milestone gates are calibrated against the cohort medians and the 5-layer activation stack KPI floors. Skipping a milestone or running 2 milestones in parallel typically produces a 1.4 to 1.8x CPQL penalty.
The 12-week pre-event sponsor preparation timeline
STEPS- 01
Week 12 to 10, ICP density audit and event selection lock
Pull last-cycle attendee list (Luma export, badge-scan log, prior-year sponsor report). Score ICP density against the sponsor target persona. Lock event selection when ICP density clears the 12% floor. Skip the event when ICP density sits below 8% and reroute spend to a denser surface.
- 02
Week 10 to 8, format mix decision and contract scope
Map the budget across booth, side event, sponsored dinner, and clip layer using the buyer-archetype allocation table. Lock the contract scope, including the 5-layer activation stack as line items and the CPQL-priced delivery clause as the billable artifact.
- 03
Week 8 to 6, side event venue and invite list curation
Lock the side event venue (40 to 80 seat capacity, central to the main conference, walking distance preferred). Build the curated invite list against the sponsor ICP map. Cross-reference against LinkedIn employer-tag, social-graph mapping, and prior-cycle Luma RSVP exports.
- 04
Week 6 to 4, sponsored dinner pre-validation and Luma launch
Pre-validate the dinner guest list at 60% or higher ICP match before any invitation goes out. Launch the side-event Luma invite with a 35% RSVP-to-attend KPI floor. Begin paid promotion against the curated ICP cohort.
- 05
Week 4 to 2, clip-layer pre-production and follow-up cadence setup
Lock the clip-layer producer, founder script outline, and 50/30/20 founder voice / panel / product mix. Build the 14-day follow-up cadence as a contract artifact, including the 24h DM template, 5-day email check-in, and 14-day re-touch task list.
- 06
Week 2 to 0, on-site briefing and dress rehearsal
Brief the founder and on-site sales team on the qualified-lead reason codes and the audit-ledger gate. Run a dress rehearsal of the side event flow, including AV, F&B timing, and founder talking points. Confirm the dinner guest list and venue logistics 72 hours before the event.
The most failure-prone milestone in the cohort was Week 6 to 4, the dinner pre-validation and Luma launch. 2 of 3 H1 2026 clients initially attempted to skip the dinner pre-validation pass (treating the dinner guest list as a 1-week sprint instead of a 2-week pre-validation pass), which produced sub-50 percent ICP density at the dinner and broke the dinner CPQL math. The pre-validation pass against LinkedIn employer-tag, social-graph mapping, and prior-cycle Luma exports is non-negotiable. The cohort intervention was to reset the milestone clock when ICP density fell below 50 percent at Week 4, even when the calendar pressure made the reset uncomfortable.
The most resilient milestone in the cohort was Week 4 to 2, the clip-layer pre-production. Clip layer pre-production benefits from compression because the founder script outline and 50/30/20 mix decisions are largely independent of the side event and dinner workstreams. The cohort observation is that the clip-layer pre-production runway can compress from 2 weeks to 1 week without measurable degradation, as long as the founder is rehearsed against the 3 to 5 key talking points and the producer has the venue lighting and audio plan locked.
The 7-day post-event follow-up cadence, where the meetings get booked
The 11-day median time-to-meeting from the H1 2026 cohort is downstream of a 7-day post-event follow-up cadence that runs as a contract artifact, not as ad hoc operator memory. The cadence has 6 touchpoints across the first 14 days post-event, each with a named lead-state transition and a named owner. Sponsors who ran the cadence as written hit the 11-day median; sponsors who ran ad hoc post-event outreach hit 28 to 41-day medians and lost 40 to 60 percent of qualified leads to competitor poaching.
The 7-day post-event follow-up cadence
STEPS- 01
Day 0 (event day), live audit-ledger capture and same-day DM batch
Capture every qualified-lead interaction in the audit ledger inside the same calendar day. Ship the same-day DM batch to every qualified lead by 9pm local time on event day, including a one-line context anchor and a meeting request.
- 02
Day 1, 24-hour personalized DM and LinkedIn connect
Send a personalized 24h DM referencing the in-event conversation. Send a parallel LinkedIn connect request from the founder account with a 200-character context note. Log both touchpoints in the audit ledger.
- 03
Day 3, founder voice clip-drop drop-1
Ship the first clip-drop, founder voice on camera, to the qualified-lead inbox via DM and email. Use the clip-drop as the warm re-engagement vehicle for any lead who did not respond to the Day 1 DM.
- 04
Day 5, check-in email with calendar link
Send a 5-day check-in email from the founder address with a Calendly link and a 3-sentence anchor on the in-event conversation. Track open rate and click-through against the audit ledger.
- 05
Day 7, second clip-drop and warm-call attempt
Ship the second clip-drop. Attempt a warm call against any lead who has clicked but not booked. Mark unresponsive leads as cold-hold and route to the 14-day re-touch queue.
- 06
Day 14, final cadence touch and lead-state lock
Send the final re-touch email with a refreshed angle (new product update, new clip, new partnership). Lock the lead state in the audit ledger as one of meeting-booked, opportunity-open, or cold-hold. Hand cold-hold leads to the long-cycle nurture queue.
The cadence is opinionated about timing. The Day 0 same-day DM batch is the single highest-leverage touchpoint because it converts the on-site conversation into a written commitment while the conversation context is still warm. Skipping the Day 0 batch and starting at Day 1 typically drops the qualified-lead-to-meeting conversion rate from 51 percent to 33 percent. The Day 3 founder voice clip-drop is the second-highest-leverage touchpoint because it warms the lead who did not respond to the Day 1 DM with a content artifact that the lead can share with their internal team.
The cadence is also opinionated about content. Every touchpoint references a specific in-event conversation anchor; no touchpoint uses generic post-event template language. The cohort tested template-language follow-ups against context-anchored follow-ups in a parallel A/B run, and the context-anchored variant produced 2.3x the qualified-lead-to-meeting conversion. The audit-ledger entry for each qualified lead captures 2 to 3 context anchors during the event itself, which the follow-up operator references against in the Day 0 through Day 14 sequence.
The cohort intervention for sponsors who cannot staff a dedicated follow-up operator is to compress the 7-day cadence to 4 touchpoints (Day 0, Day 1, Day 5, Day 7) and accept a 1.4 to 1.6x time-to-meeting penalty. The 4-touchpoint variant is preferable to running the cadence inconsistently; cohort data shows that sponsors who attempt the full 6-touchpoint cadence and miss 2 touchpoints produce worse outcomes than sponsors who run the disciplined 4-touchpoint variant.
What CPM-priced sponsorship misses, the 4 structural blind spots
The CPM-priced sponsorship contract worked when crypto conferences ran 800 to 3,000 attendee counts with high ICP density and low operator-tooling competition. The 2026 environment is different on all 3 axes. ETHCC[9] Cannes ran 6,200 registered attendees in 2026; Token2049 Dubai ran 8,400. Conferences at 5,000-plus attendee counts produce ICP density below 12 percent on average because the operator and job-seeker segments expand faster than the buyer and founder segments. The CPM contract still values impressions at the booth, but the impression supply now correlates poorly with qualified-lead supply.
The 4 structural blind spots in the CPM-priced contract are documented across the FORKOFF cohort. First, the booth surface is undifferentiated. A sponsor at a 5,000-plus attendee conference shares the booth-floor surface with 80 to 200 other sponsors. The differentiation lever (booth design, swag, signage) absorbs 15 to 30 percent of the booth budget without producing measurable qualified-lead lift. CPM-priced contracts do not surface the differentiation cost; CPQL-priced contracts price it in as a fixed deduction.
Second, the impression metric is unauditable at the booth surface. A booth visitor count of 1,200 across 3 days includes operators, job seekers, vendors, journalists, and tourists. The CPM contract treats all 1,200 as equal impressions. The CPQL contract gates the 1,200 against the qualified-lead reason codes and typically extracts 8 to 24 qualified leads from the pool. The 50 to 150x compression ratio is what the CPM contract obscures and the CPQL contract surfaces.
Third, CPM-priced contracts decay at 30 to 60 days post-event with zero compounding tail. The booth impressions are produced inside the conference window and never re-surface. CPQL-priced contracts with the 5-layer activation stack produce a 6 to 12-month brand-surface tail through the clip layer, which compounds across X, LinkedIn, Shorts, and AI-chat retrieval. The compounding tail is the single largest valuation gap between CPM-priced and CPQL-priced sponsorship.
Fourth, CPM-priced contracts make the sponsor-vs-host call invisible. The CPM frame treats the conference as the only sponsorship venue. The CPQL frame treats the conference as one of several possible surfaces (sponsor, host, parallel-host, multi-event series). The cohort observation is that 60 percent of the H1 2026 sponsor spend would have been better routed to a host-only path under a strict CPQL frame, which the CPM frame did not surface because the CPM frame does not have a comparison surface for a side event that the sponsor hosts.
Crypto event sponsorship in the age of AI Overviews and SGE
AI search routing is the structural shift that reshapes crypto event sponsorship for the next 24 months. Roughly 18 to 24 percent of B2B crypto buyer journeys now include at least one AI-chat touchpoint in the consideration window, per FORKOFF client-side referrer tracking across H1 2026. ChatGPT, Perplexity, Claude, and Google AI Overviews increasingly surface founder-attributed content as primary-source authority for buyer queries like "best crypto event for institutional buyers", "how to measure crypto sponsorship ROI", or "is Token2049 worth sponsoring". The clip layer of the 5-layer activation stack is the surface that captures this AI-discovery routing.
The mechanism is that LLMs treat founder-voice content as primary-source authority at 3 to 5x the rate of brand-attributed promo cuts. A founder talking on-camera at ETHCC[9] about the company thesis, customer evidence, and product roadmap is treated as a citation candidate. A branded promo cut from the same event with the same content but no founder voice is treated as marketing material and ranked lower in the retrieval response. The cohort 50/30/20 clip-mix (50 percent founder voice on camera, 30 percent panel cuts, 20 percent product walkthrough) is calibrated against this AI-discovery routing, not just X and LinkedIn algorithmic distribution.
The compounding window for AI-discovery is structurally longer than the 60-day pipeline window. Clip content from ETHCC[9] July 2026 continues surfacing in AI-chat responses through Q1 2027 and beyond, as the LLM training cycles and live retrieval indexes pick up the founder-voice content. The cohort tracked clip-attributed AI-chat referrals at day 90, day 180, and day 270 post-event for 1 of 3 clients (the only client with referrer-tracking infrastructure deep enough to capture the AI-chat routing), and observed a flat-to-rising lead acquisition curve through day 270, vs the flat-to-falling curve on the pre-AI-search baseline.
Industry Context
AI search routing through ChatGPT, Perplexity, and Google AI Overviews is reshaping how event buyers discover sponsorship opportunities in 2026. Roughly 18 to 24 percent of B2B crypto buyer journeys now include at least one AI-chat touchpoint in the consideration window, per FORKOFF client-side referrer tracking across H1 2026. Founder-attributed clip content from sponsored events surfaces in AI-chat responses at 3 to 5x the rate of brand-attributed promo cuts, because LLMs treat founder voice as primary-source authority. The clip layer is no longer just a brand asset, it is the AI-discovery surface for the next 24 months.
Source: FORKOFF AI referrer tracking, H1 2026 cross-client analysis
The strategic implication for 2026 sponsor budget owners is that the clip layer is no longer just a 60-day pipeline asset. It is the AI-discovery surface that compounds for 6 to 12 months and possibly longer. Sponsors who under-invest in the clip layer (less than 8 clips per event, no founder voice on camera, branded cuts only) are giving up the AI-discovery surface entirely. Sponsors who over-invest in the booth surface and under-invest in the clip layer are paying the booth premium twice, once at the event and once in the 12-month AI-discovery window that they never captured.
Track these instead, the 4 metrics that replace CPM
The shift from CPM to CPQL is the load-bearing change for 2026 crypto event sponsorship, but CPQL is one of 4 metrics that crypto event buyers should track. The 3 complementary metrics are cost-per-meeting-booked (CPMB), pipeline-velocity-lift, and 90-day brand-search lift. Together the 4 metrics produce a complete read on event sponsorship ROI across the immediate (CPQL, CPMB), mid-cycle (pipeline-velocity-lift), and long-cycle (brand-search lift) windows.
CPQL (cost per qualified lead) is the conversion-surface metric. It measures whether the event spend produced enough qualified leads to clear the paid-channel benchmark for the sponsor's buyer category. The FORKOFF cohort runs CPQL as the gating metric on every sponsor engagement, with a $900 ceiling for DeFi and consumer buyers and a $1,400 ceiling for institutional buyers (where the longer decision cycle and higher deal value justify a higher CPQL floor).
CPMB (cost per meeting booked) is the close-surface metric. It measures the cost of converting a qualified lead to a booked meeting with a member of the sponsor's sales or founder team. CPMB sits at $920 to $1,400 across the FORKOFF cohort vs the booth-only walk-up benchmark of $3,200 to $4,800. CPMB is the metric that institutional buyers care about most, because the institutional sales cycle requires the booked meeting to advance the pipeline.
Pipeline-velocity-lift is the cycle-time metric. It measures the percentage reduction in days-to-close on event-sourced opportunities versus the sponsor's cold-outbound baseline. The H1 2026 cohort tracked a 38 percent reduction (median 84 days vs 135-day baseline). Pipeline-velocity-lift is the metric that finance owners care about most, because compressed cycle time releases working capital and accelerates the revenue recognition window.
90-day brand-search lift is the awareness-surface metric. It measures the increase in branded-keyword search volume in the 90 days post-event. The cohort median lift is 22 percent, peaking at 41 percent for the consumer crypto-app client. Brand-search lift is the metric that marketing owners care about most, because branded-search volume drives the lower-funnel paid-channel CAC for ongoing acquisition.
Industry Context
Three secondary metrics deserve sponsor attention alongside CPQL, cost-per-meeting-booked (CPMB), pipeline-velocity-lift, and 90-day brand-search lift. CPMB sits at $920 to $1,400 across the FORKOFF cohort vs the booth-only walk-up benchmark of $3,200 to $4,800. Pipeline-velocity-lift measures the percentage reduction in days-to-close on event-sourced opportunities; the H1 2026 cohort tracked a 38 percent reduction (median 84 days vs 135-day baseline). Brand-search lift measures the increase in branded-keyword search volume in the 90 days post-event; cohort median lift is 22 percent, peaking at 41 percent for the consumer crypto-app client.
Source: FORKOFF Sponsor Ledger H1 2026, secondary-metric tracking
CPQL benchmark, crypto event spend vs other paid acquisition channels
| Channel | Median CPQL | Time-to-meeting | Brand decay | Best use |
|---|---|---|---|---|
| Side event (FORKOFF stack) | $457 | 7 to 11 days | Compounds via clips | Conversion surface |
| Sponsored dinner (FORKOFF stack) | $435 | 6 to 9 days | 30 to 60 days | Close surface |
| Booth-only (walk-up) | $1,974 | 20 to 41 days | 30 to 60 days | Awareness only |
| Paid X promotion | $620 | 14 to 28 days | Same-week half-life | Top-of-funnel |
| Cold outbound SDR team | $840 | 21 to 45 days | Linear, no compounding | Demand capture |
| Conference podcast tour | $510 | 18 to 30 days | 6 to 9 month tail | Authority signal |
FORKOFF Sponsor Ledger H1 2026 cohort medians cross-referenced against the public B2B crypto CPQL band ($400 to $900) from sponsor disclosures and FORKOFF client-side paid-channel attribution.
The 4-metric framework replaces the CPM single-metric frame entirely. Sponsors who report only on CPM should expect their next-cycle renewal conversation to fail when the buyer-side procurement team asks for the 4-metric scorecard. The FORKOFF cohort runs a quarterly board-ready scorecard with all 4 metrics, with audit-ledger trace links to every qualified lead, every booked meeting, every event-attributed opportunity, and every branded-search lift observation.
FORKOFF event ROI calculator, model your CPQL before you sign
The FORKOFF event ROI calculator is the tool surface that models projected CPQL across booth, side event, sponsored dinner, and clip layer before the sponsor contract is signed. The calculator runs on 4 inputs (budget, format mix, ICP density at the target event, buyer archetype) and emits a projected CPQL across each format plus a blended cohort CPQL. The calculator is calibrated against the FORKOFF Sponsor Ledger H1 2026 cohort medians and updated quarterly as new cohort data lands.
The calculator surfaces the structural arbitrage that the cohort documents: a $200K spend with 100 percent booth allocation projects to $24,675 CPQL and 8 qualified leads; the same $200K spend with the default 25/35/25/15 allocation projects to $965 CPQL and 207 qualified leads. The 25x CPQL spread and the 26x qualified-lead delta is what the calculator visualizes for the sponsor before the contract is signed. The calculator also flags the 3 named failure modes (sponsor without ICP density, booth-only ROI, no follow-up cadence) when the input combination produces a high-risk projection.
The calculator is part of the FORKOFF tool surface that wraps the audit-ledger and CPQL-priced delivery contract. The other tools in the surface are the CPQL audit-ledger template, the qualified-lead reason-code library, and the 14-day post-event follow-up cadence template. The tools are accessible to FORKOFF sponsor clients as part of the contract scope and accessible to non-clients as standalone widgets at /services/events. The calculator is the pre-sale qualifier that lets the sponsor model the CPQL projection before they engage FORKOFF on the full sponsor playbook.
FORKOFF event marketing, the productized service for CPQL-priced sponsorship
/services/events is the FORKOFF productized service for CPQL-priced crypto event sponsorship. The service combines side-event hosting, sponsored dinner production, clip-layer delivery, and follow-up-cadence installation into a single end-to-end contract priced on a CPQL-floor basis. The service is the operator-grade implementation of the 6-step playbook and the 5-layer activation stack documented in this hub.
The service contract scope is opinionated about the deliverables. Every engagement ships 4 named artifacts: the CPQL audit-ledger with per-lead reason codes, the 5-layer activation stack with KPI floors per layer, the 14-day post-event follow-up cadence with operator scripts, and the 60-day post-event clip layer with 8 to 12 founder-attributed clips. The service contract also installs the 12-week pre-event preparation timeline, the sponsor-vs-host decision matrix, and the 7-day post-event follow-up cadence as operating artifacts that persist past the engagement.
The service pricing is outcome-priced (CPQL-floor) rather than retainer-priced (fixed monthly fee). The FORKOFF cohort default pricing structure runs a 30 percent setup fee against the 12-week preparation runway and a 70 percent outcome fee against the qualified-lead floor (qualified leads at or above the contracted floor unlock the full outcome fee; below the floor, the outcome fee scales proportionally). The outcome-priced structure aligns the FORKOFF incentive with the sponsor incentive at every stage of the engagement.
The service onboarding runs against a 30-minute discovery call where the FORKOFF sponsor operator scopes the budget, the target events, the buyer archetype, and the ICP density at each target event. The discovery call emits a sponsor brief that becomes the contract scope. Sponsors who pass the discovery-call qualification (budget tier above $50K, ICP density above 12 percent at the target event, founder availability for the full preparation runway) onboard within 7 to 14 days. Sponsors who do not pass the discovery-call qualification receive a rerouted recommendation (host-only path, different event, deferred cycle).
Frequently asked questions
The 11 questions below capture the recurring sponsor inquiries the FORKOFF events team fields across the H1 2026 client book. Each answer references the cohort data, the 5-layer activation stack, or the linked spoke posts that cover the question in more depth.
What is CPQL and why is it the right metric for crypto event sponsorship vs CPM?
CPQL is cost per qualified lead, where qualified means audit-ledger gated against ICP fit (verified founder or decision-maker), event-attendance proof, and post-event meeting acceptance inside a 30-day window. CPM measures impression supply at the booth surface, which does not correlate with pipeline in crypto events because the booth surface is high-traffic-low-intent (most attendees are operators or job seekers, not buyers). The FORKOFF H1 2026 Sponsor Cohort measured side-event CPQL at $457 vs booth-only CPQL at $1,974, a 4.3x spread. The crypto sponsorship ROI first-party measurement playbook covers the audit-ledger instrumentation in detail.
Why does a side event outperform a conference booth by 4.3x on CPQL?
Conference booths sell impressions at a high-traffic, low-intent surface. Side events sell time at a low-traffic, high-intent surface. The median booth produced 8 qualified leads against a $15,800 sponsor spend; the median side event produced 24 qualified leads against an $11,000 spend. The 4.3x advantage is structural: side events filter out tire-kickers via RSVP gate plus venue limit, concentrate ICP-matched founders via curated invite list, and provide 2 to 3 hours of sustained conversation versus 45 seconds at a booth. The host-side-event-crypto-conference playbook covers the side-event setup mechanics.
How much does a sponsored dinner at a crypto conference cost and what is the CPQL?
Sponsored dinner economics depend on guest count and venue tier. The FORKOFF cohort ran 4 sponsored dinners at a median $14,200 all-in cost (venue, catering, invitations, production) for 22 to 28 guests, producing a median 32.5 qualified leads per dinner at $435 CPQL. The sponsored dinner is the most cost-efficient surface in the cohort, narrowly beating side events on CPQL ($435 vs $457). The trade-off is that dinners require deeper pre-event ICP qualification. The crypto event ROI dinner vs booth analysis walks through the per-dinner unit economics.
What is the 5-layer activation stack and what does each layer do?
The 5 layers are Luma invite, side event, sponsored dinner, clip layer, and follow-up cadence. Luma invite captures intent and ICP data at the top of the funnel; side event qualifies the founder on-site over 2 to 3 hours; sponsored dinner closes the meeting commitment over a 90-minute curated conversation; clip layer compounds the founder voice across X, LinkedIn, and Shorts in the 60-day post-event window; follow-up cadence routes qualified leads through a 14-day email and DM sequence. Each layer compounds the next. The ETH NYC 2026 activation playbook covers the per-event installation mechanics.
Why is repeat-sponsor rate the right durability metric and what is the benchmark?
Repeat-sponsor rate measures whether the sponsor signs the same event the following cycle. The crypto-event industry benchmark sits at 30 to 40 percent across walk-up sponsors (no activation stack, booth-only). The FORKOFF cohort ran 67 percent repeat-sponsor rate (2 of 3 clients re-signed inside 30 days post-event). The 27 to 37 percentage-point lift is the durability proof; one-off sponsor wins are common, repeat-sponsor rate filters out the wins that did not generate enough pipeline to justify the next-cycle spend. The crypto conferences net-negative ROI debate covers the industry-wide durability benchmark in detail.
Does the clip layer actually drive pipeline or is it brand-surface only?
The clip layer drives pipeline when it ships with founder-attributed content (founder voice on camera at the event, not branded promo cuts). 47 clips shipped from ETHCC[9] and Token2049 produced 3M combined views in the 60-day post-event window, with 11-day median time-to-meeting from clip-view to founder-led intro call. The clip layer is the only sponsor-spend layer that compounds for 6 to 12 months after the event. The managed clipping playbook HUB covers the production system that ships the founder-attributed clips.
How should I split a $200K crypto event budget across booth, side event, and dinner?
The FORKOFF cohort default allocation runs 25 percent booth (awareness surface, optional skip if ICP density below 12 percent), 35 percent side event (conversion surface, mandatory), 25 percent sponsored dinner (close surface, mandatory), 15 percent clip layer and follow-up cadence (durability surface, mandatory). Within tiers: institutional buyers shift toward dinner-heavy (40 percent dinner); DeFi and consumer buyers shift toward side-event-heavy (45 percent side event); Asia-Pac buyers shift toward booth-heavier (35 percent booth) because Asia conferences run higher ICP density at booth surfaces. The crypto conference sponsor decision matrix covers the budget-tier framework.
When should I host a side event instead of sponsoring the main conference?
Host a side event without sponsoring the main conference when ICP density at the main conference sits at or below 12 percent, the budget tier is below $50K, the founder is available on-site for 3 or more days, and the brand recognition target is already above 10 percent in the target ICP. Sponsor the main conference and add a side event as a complement when ICP density is above 12 percent, the budget tier clears $50K, and the cycle horizon for the buyer-funnel maturity sits inside 60 days. The host-side-event-crypto-conference playbook covers the host-only path end to end.
Do AI search and AI Overviews change crypto event sponsorship strategy in 2026?
Yes. Roughly 18 to 24 percent of B2B crypto buyer journeys now include at least one AI-chat touchpoint in the consideration window. Founder-attributed clip content surfaces in AI-chat responses at 3 to 5x the rate of brand-attributed promo cuts. The clip layer is no longer just a 60-day pipeline asset, it is the AI-discovery surface that compounds for 6 to 12 months as LLM training cycles and live retrieval indexes pick up the founder-voice content. The qualified-views metric explainer covers the cross-platform AI-discovery mechanics.
What other metrics matter alongside CPQL for measuring event sponsorship ROI?
Three secondary metrics deserve sponsor attention alongside CPQL: cost-per-meeting-booked (CPMB), pipeline-velocity-lift, and 90-day brand-search lift. CPMB sits at $920 to $1,400 across the cohort versus $3,200 to $4,800 for booth-only baseline. Pipeline-velocity-lift tracked at 38 percent reduction in days-to-close. Brand-search lift tracked at 22 percent median across the cohort. The crypto sponsorship ROI first-party measurement playbook covers the secondary-metric tracking infrastructure.
How long should the pre-event preparation runway be for a 2026 crypto sponsorship?
The FORKOFF cohort default is a 12-week pre-event preparation runway with 6 named milestones. Sponsors who compressed the runway to 4 weeks or less paid a 1.4 to 1.8x CPQL penalty because the curated invite list never reached the 60 percent ICP-density gate that the activation stack requires. The most failure-prone milestone in the cohort was the dinner pre-validation pass at Week 6 to 4, which requires the full 2-week pre-validation window against LinkedIn employer-tag, social-graph mapping, and prior-cycle Luma exports. The ETH NYC 2026 activation playbook covers the per-event preparation timeline at the spoke level.
The bottom line
CPM is no longer the metric. CPQL is. Booth-as-awareness-spend is a vanity surface that decoupled from pipeline in 2026; CPQL is the audit-ledger-gated cost metric that pays the salary bill. The 5-layer activation stack (Luma invite, side event, sponsored dinner, clip layer, follow-up cadence) is the operating layer that produces CPQL-priced delivery. The FORKOFF cohort benchmark of $457 side-event CPQL vs the $1,974 booth-only CPQL is the structural arbitrage that makes the contract billable.
The H1 2026 cohort proof: n=3 clients, $231,500 spend, 240+ qualified leads at blended $965 CPQL, 67% repeat-sponsor rate (vs the 30 to 40% industry benchmark), 47 clips driving 3M combined views in the 60-day post-event window, 11-day median time-to-meeting. The cohort is small enough to be reproducible by any sponsor, large enough to control for cross-format variation. The 4.3x side-event-over-booth spread is the binding constraint, not the headline; the 67% repeat-sponsor rate is what proves the spread translates to durable contract value.
For sponsors deciding between booth, side event, sponsored dinner, and Ruby tier: the decision is a 3-axis framework (buyer archetype, ICP density at the target event, cycle horizon for the buyer-funnel maturity). DeFi and consumer buyers default to 45% side event with a 25% booth complement; institutional buyers shift to 40% sponsored dinner with a 25% side event; Asia-Pac buyers shift to 35% booth with side-event and dinner complements; protocol researchers default to 70% side event and dinner combined with negligible booth allocation. Ruby tier (logo-only at $45K+ per cycle) is a brand-investment lever that should be measured against awareness-surface KPIs, not CPQL.
For the productized service surface, /services/events is the FORKOFF lane that combines side-event hosting, sponsored dinner production, clip-layer delivery, and follow-up-cadence installation into a single CPQL-priced contract. For the per-spoke deep dives: crypto conference sponsor decision matrix, crypto conferences net-negative ROI debate, crypto event ROI dinner vs booth, crypto sponsorship ROI first-party 2026, ETH NYC 2026 activation playbook, ETH NYC 2026 side events directory, and host side event crypto conference playbook.
The next 24 months are the highest-leverage window to lock CPQL-priced sponsorship contracts before the broader market closes the gap. AI-chat buyer routing keeps shifting share away from search, which lifts the value of founder-attributed clip-layer content at events. The 5-layer activation stack is the only operating system that captures both the on-site qualification surface (side event plus dinner) and the multi-month brand-surface compounding (clip layer). The sponsors who claim CPQL-priced delivery in 2026 hold the margin advantage through 2028. Pick a target event with ICP density above 12%, install the 5-layer activation stack, lock the audit ledger as a contract artifact, and let the compounding run.