Skip to content
FORKOFF

Per our own views-to-likes benchmark of 5,375 creators, an engagement ratio outside the observed band is the cheapest tell that a launch was amplified.

FORKOFF · Tools

What does this KOL deal actually cost?

Real math, not a rate-card. Pick platform × tier × content × vertical × geo, see the market rate range, modeled qualified-view delivery, and the FORKOFF KOL audit-ledger benchmark on the same dollars.

5 axes to a market rateFORKOFF Ledger · v1

Real math. No rate-card.

Updates as you pick

1.5% engagement baseline

100k-500k followers

1.0x multiplier

1.50x premium

1.00x region

Default = tier midpoint. Override for actual creator follower count.
Embed snippet
<iframe
  src="https://forkoff.xyz/tools/kol-rate-calculator/embed"
  width="100%"
  height="1300"
  frameborder="0"
  loading="lazy"
  title="KOL Rate Calculator by FORKOFF"
></iframe>
Blog post (WordPress / Ghost / Hashnode)

Paste into a Custom HTML block.

Notion page

Use /embed and paste the iframe src URL.

Webflow or static site

Drop into an Embed element. Lazy-loaded by default.

Default height 1300px (adjust to fit)Free, no attribution requiredCC BY 4.0
How it works

Five axes decide what the deal actually costs.

The calculator multiplies tier, platform, content, vertical, and geo deterministically, returns a market rate range with modeled qualified-view delivery, and exposes the FORKOFF KOL audit-ledger benchmark on the same campaign. Every output ratio falls out of the math. To sanity-check a quoted rate against real delivery, our breakdown of CPM rates for clipping shows what a qualified view actually costs.

Audit-proof wedge

Market mid CPV vs FORKOFF KOL audit-proof CPV. The dial shows the live ratio.

Wedge = market mid rate ÷ FORKOFF KOL audit-proof cost on the same qualified-view target. The verified proof gates spend to bot-clean, watch-time-validated, geo-qualified, ICP-fit views. The dial shows the live wedge for the inputs above.

Benchmark

$0.04

KOL audit-proof CPV (NOT $0.003, clipping only)

420+

Managed placements in the calibration corpus

Axis 01platform
X1.0xLINKEDIN1.6xYT-LONG4.0xIG-REEL1.6xTIKTOK1.3xTELEGRAM0.6x

Platform multiplier.

Off the X baseline. YouTube long-form 4x, LinkedIn 1.6x, Telegram 0.6x. Platform sets engagement-rate baseline + dollar multiplier in one move.

Axis 02tier
MEGA · $70kMACRO · $16kMID · $4.5kMICRO · $1.1kNANO · $150

Tier ladder.

Five bands. Nano $150 baseline · Micro $1.1k · Mid $4.5k · Macro $16k · Mega $70k. Each band is the platform-X-single-post midpoint before any multiplier.

Axis 03content
LONG-FORM · 2.5xTHREAD · 1.4xUGC CLIP · 1.1xPOST · 1.0xSTORY · 0.4x

Content stack.

Long-form 2.5x, thread 1.4x, UGC clip 1.1x, post 1.0x, story 0.4x. Same creator, different deliverable, different price.

Axis 04vertical
CRYPTO1.50xAI1.40xFINTECH1.25xSAAS1.15xCONSUMER1.00x

Vertical premium.

Crypto + AI carry biggest premiums (1.5x, 1.4x). Fintech 1.25x. SaaS 1.15x. Consumer DTC is the floor at 1.0x.

Axis 05geo
GLOBAL1.10xUS1.00xEU0.90xSEA0.60xLATAM0.55x

Geo / region.

US baseline, Global +10%, EU 0.9x, SEA 0.6x, LATAM 0.55x. Audience LTV decides regional multiplier, not creator HQ.

Axis 06proof
MARKET MID CPV$0.50FORKOFF KOL LEDGER$0.04AUDIT-LEDGER WEDGE~12.5x

Audit-proof wedge.

Market mid CPV vs FORKOFF KOL proof CPV ($0.04). Typical wedge 4-12x because proof spend is gated to qualified delivery.

The model

Four inputs in. Three outputs out.

Inputs · what the calculator needs

Input 01

Input 01

Platform. Eight surfaces supported (X, LinkedIn, YouTube long-form + Shorts, Instagram post + reel, TikTok, Telegram). Platform sets engagement-rate baseline and dollar multiplier off X.

Input 02

Input 02

Tier. Five follower bands, Nano (1k-10k), Micro (10k-100k), Mid (100k-500k), Macro (500k-2M), Mega (2M+). Tier sets the base dollar value before any multiplier.

Input 03

Input 03

Content type. Single post · thread · long-form video · story · UGC clip. Each carries a content multiplier (long-form 2.5x, thread 1.4x, story 0.4x).

Input 04

Input 04

Vertical and geo. Vertical premiums stack on the rate (Crypto 1.5x, AI 1.4x, SaaS 1.15x, Consumer 1.0x). Geo applies a regional multiplier (US/Global premium, SEA + LATAM discount).

Outputs · what the calculator returns

Output 01

Output 01

Market rate range. Low / mid / high in USD for the chosen 5-axis cell. Mid is the median across the FORKOFF KOL audit-ledger benchmark set; low + high are the 30th / 80th percentile.

Output 02

Output 02

Modeled qualified-view delivery. Followers × platform engagement rate × FORKOFF filter coefficient (≈0.6 across the ledger). The number you actually buy.

Output 03

Output 03

FORKOFF KOL audit-ledger benchmark. Same campaign run through the FORKOFF KOL Marketing service, outcome-priced billing on QVs that survive bot + watch-time + geo + ICP-fit filters.

Definition

What does a KOL rate calculator actually compute?

Most KOL rate-cards quote a single dollar number per post and call it pricing. That hides what actually decides value: tier × platform × content type × vertical × geo. This calculator multiplies those five dimensions deterministically, returns a market rate range, models the qualified-view delivery on that rate, and shows the FORKOFF KOL audit-ledger benchmark on the same engagement. Real math, no API call, no signup.

Scenarios

Four sample deals across vertical + tier.

Each card is a real cell the calculator is asked to price often. Run the live tool above to test your own combination.

Scenario 01

$0.34 CPV

Crypto Macro · long-form YouTube

Macro (1.2M YT subs) · long-form video · Crypto · Global. Quoted at $85k.

Market mid

$72k

QV delivery

210k QV

  • Rate fairnessMixed
  • CPV ≤ benchmarkPass
  • Audit-proof liftPass

Recommendation

Quote 18% above market mid. Ask for the last 5 sponsored-video QV deliveries before paying high-band. FORKOFF audit-ledger run on same QV target ≈ $8,400.

Scenario 02

$2.40 CPV

AI Mid · X thread

Mid (260k followers) · thread · AI · US. Quoted at $9,500.

Market mid

$8.4k

QV delivery

3,500 QV

  • Rate fairnessPass
  • CPV ≤ benchmarkFail
  • Audit-proof liftPass

Recommendation

Rate is fair, but $2.40 CPV is 60x the FORKOFF KOL ledger floor. Either negotiate by-QV billing or run the same campaign on the audit-ledger model (~$140 for the same 3,500 QVs).

Scenario 03

$1.50 CPV

Consumer Micro · IG reel

Micro (45k followers) · reel · Consumer DTC · US. Quoted at $1,800.

Market mid

$1.5k

QV delivery

1,200 QV

  • Rate fairnessMixed
  • CPV ≤ benchmarkPass
  • Audit-proof liftPass

Recommendation

Reasonable creator-economy rate. CPV is high vs other channels but reels carry brand-fit value paid social can't replicate. FORKOFF audit-ledger lift ≈ 35x on same QV count.

Scenario 04

$0.73 CPV

Crypto Nano cluster · Telegram

10 Nano channels (avg 6k subs) · single posts · Crypto · Global. Quoted at $3,500 total.

Market mid

$2.8k

QV delivery

4,800 QV

  • Rate fairnessMixed
  • CPV ≤ benchmarkFail
  • Audit-proof liftPass

Recommendation

Telegram clusters look lower-cost per-channel but inflate on bot followers. Run the FORKOFF audit ledger on the same cluster, typical reduction is 70-85% of channels failing the bot filter.

KOL verified proof · 420+ managed placements

FORKOFF KOL Marketing prices on qualified delivery, not gross reach.

The verified proof filters bot followers, off-geo views, sub-floor watch-time, and ICP misfire before any spend counts. Benchmark CPV across managed engagements is $0.04, 4-12x below market median for the same tier × vertical × content cell. $0.003 CPQV is the FORKOFF Clipping product floor and applies to the clipping channel only.

How much do influencers charge in 2026?

A single sponsored post on X runs from $50 for a nano creator to $150,000for a mega account in this calculator's rate model, and the spread inside each tier is wider than the spread between neighbouring tiers. Follower count sets the band; platform, content type, vertical and audience geography then move the price inside it, which is why a single quoted number tells you very little.

TierFollowersX post, low to highMidpoint
nano1k-10k$50 to $300$150
micro10k-100k$250 to $2,500$1,100
mid100k-500k$1,500 to $8,000$4,500
macro500k-2M$7,000 to $30,000$16,000
mega2M+$25,000 to $150,000$70,000

Source: the FORKOFF KOL rate model this calculator runs, X single-post baseline.

How to choose between micro-influencers and macro-influencers

Choose by what the campaign has to prove. A macro post at the $16,000 midpoint costs about as much as 14 micro posts at $1,100 each, so the real question is whether one large audience or many small, specific ones reaches your buyer. Macro buys reach and a single recognisable name. Micro buys repetition inside a niche and more chances to find the creators whose audience actually converts.

For a first campaign in a narrow category, several micro creators usually teach you more for the same budget, because you learn which audiences respond before committing to one expensive placement. Macro makes sense once you know the message works and the goal is scale.

Source: tier midpoints from the FORKOFF KOL rate model.

KOL rates by platform

The same creator charges differently on each platform, because the format, the production effort and the typical engagement differ. This calculator prices every platform as a multiple of the X single-post baseline, so a creator quoting one rate across TikTok, YouTube and Instagram is either discounting one platform or overcharging on another.

TikTok

Priced at 1.3x the X baseline, with a modeled median engagement rate of 5%. Short, native video carries reach well, but the audience skews toward consumer categories.

YouTube

Long-form is the most expensive format at 4x the baseline, because a dedicated segment or review takes real production and keeps working for months. Shorts price at 1.2x with a modeled engagement rate of 4%.

Instagram

A feed post prices at 1.4x the baseline (2.2% modeled engagement) and a reel at 1.6x (4.5%). For comparison, X itself sits at 1x with 1.5%.

Source: platform multipliers and engagement rates from the FORKOFF KOL rate model.

CPM and CPE: the two unit costs worth calculating

CPM is the cost per thousand impressions: the fee divided by impressions, times 1,000. CPE is the cost per engagement: the fee divided by likes, replies, reposts and clicks. Work out both before you accept a quote, because a creator with a low CPM and a high CPE is selling reach that nobody acts on, and that is the most common way a KOL budget disappears quietly.

The KOL ROI formula

KOL ROI is attributed return minus total cost, divided by total cost. Total cost has to include the creator fee, any usage rights or whitelisting, production, and the team time spent managing the placement. Attributed return is what you can trace to the post: sales on a code or link, booked calls, signups, and partnership conversations that name the creator as the source.

Measure the return on outcomes you can trace, not on reach. A post that trends and produces no traceable action has a return of zero on this formula, however good the screenshot looks.

Go beyond pricing estimates

A rate estimate tells you whether a quote is reasonable. It does not tell you whether the creator is worth paying at any price. Before a deal, look at three things a rate card never shows: how real the engagement is, how many people actually saw recent posts, and how the audience talks about brands the creator has already promoted.

Engagement data

Compare the creator's engagement rate on recent sponsored posts against their organic posts and against the platform medians above. Engagement that collapses on sponsored content, or replies that read like bots, is the signal to walk away.

Impression data

Ask for impressions or views on the last five sponsored posts, not follower count. Followers are a ceiling; impressions are what you are buying.

Sentiment quality

Read the replies under past brand deals. An audience that asks questions and tags friends is buying attention; an audience that mocks the sponsorship will do the same to yours.

Indirect value

Some return never shows up on a code: content you can reuse in ads, a creator who keeps mentioning the product unpaid, and credibility with the next creator you approach. Count it, but never let it stand in for the traceable return the ROI formula needs.

Related terms

The words that come up when pricing a creator deal, defined the way this calculator uses them, so a quote from a manager and an estimate from the tool can be compared line by line without anyone quietly meaning something different by the same word.

KOL
Key opinion leader: a creator whose recommendation moves a specific audience.
CPM
Cost per thousand impressions.
CPE
Cost per engagement.
CPV
Cost per view, for video placements.
Usage rights
Permission to reuse the creator's content in your own channels or ads, priced separately.
Whitelisting
Running paid ads through the creator's own account, also priced separately.

Next steps

Run your combination in the calculator above to get a range, then check the quote you were given against it. If the quote sits well above the high end, ask the creator for impression data on recent sponsored posts before negotiating. If you would rather have creators screened and briefed for you, see how FORKOFF runs KOL marketing.

Comparison

Why a 5-axis deterministic model beats a single-number rate-card.

Public rate-cards anchor on outliers. Manager quotes hide multipliers. The FORKOFF model splits the rate cell-by-cell and surfaces the audit-proof benchmark on the same campaign.

← scroll horizontally to see more →

FeatureFORKOFF KOL rate calc5-axis deterministic + audit-ledger benchmarkPublic rate-cardsInfluencer Marketing Hub · GRIN · HeepsyManager quotesSingle-number quote from talent repInfluencer DBsCreatorDB · Modash · Klear
Splits rate by platform × tier × content × vertical × geopartialpartial
Models qualified-view delivery, not gross reach
Surfaces the FORKOFF audit-ledger benchmark on the same campaign
Free, no signup, no creator-DB subscription
Updated against a real KOL audit ledger quarterlypartialpartial
Returns range, not single numberpartial
Best for piece-by-piece creator discovery + outreachpartialpartial
Fit map

Who the calculator is built for.

If your decision lands in the left column, the calculator is the right surface. If it lands in the right, use a different tool.

Built for this

  • ·Founders or marketers sizing a KOL budget for the first time and need a defensible market range.
  • ·Procurement teams stress-testing a creator's quoted rate against the audit-ledger benchmark.
  • ·Crypto / AI / fintech brands negotiating with talent reps and need real numbers behind the offer.
  • ·Agencies building KOL media-mix decks and need per-cell rate ranges.
  • ·Brands pivoting from gross-reach buying to qualified-view billing and need to model the wedge.

Not the right fit

  • ·Discovering specific creators by handle. Use Modash or CreatorDB for the directory layer.
  • ·Authenticating a creator's follower count. Use HypeAuditor / SparkToro for audit-only.
  • ·Negotiating long-term ambassador contracts. The model is single-placement; multi-quarter deals run different math.
  • ·Pricing celebrities (10M+ followers, mainstream press). Mega-tier ceiling here is $150k; A-list pricing is custom.
  • ·Mass-DM outreach. The calculator is a budget tool, not an outreach engine.
FAQ

KOL rate calculator. Questions answered.

What does the KOL rate calculator actually compute?

It multiplies five dimensions deterministically, platform × tier × content × vertical × geo, to return a market rate range (low / mid / high), models the qualified-view delivery, and shows the FORKOFF KOL audit-ledger benchmark on the same campaign. No external API call. The calculation is identical for every visitor.

Where do the rate benchmarks come from?

Calibration corpus: the FORKOFF KOL audit-ledger (managed engagements with bot + watch-time + geo + ICP filters), public 2025-2026 rate-cards (Influencer Marketing Hub, GRIN, Heepsy, CreatorDB), and reported deal flow from talent agencies. Updated quarterly. Mid rate is the audit-ledger median; low / high are 30th / 80th percentile.

Why is the crypto vertical premium 1.5x?

Two reasons. (1) Crypto creator economics priced higher in 2024-2026 because token-launch sponsorships pay in volatility-discounted equity, which inflates dollar-equivalent rates 30-50% over flat-fee categories. (2) Crypto audiences convert at higher dollar-per-view than consumer DTC because deal sizes are 5-20x larger. The 1.5x multiplier captures both.

Does the calculator work for nano-tier (under 10k followers)?

Yes, but the variance widens. Nano rates land $50-$300 per X post baseline, and the model's confidence interval doubles below 5k followers because engagement rate dominates raw follower count at that tier. Use the calculator as a directional anchor, not a floor; pay-per-post for nano often makes more sense than pay-by-tier.

What is the FORKOFF KOL audit-ledger benchmark?

FORKOFF KOL Marketing service prices on outcome, clients pay for qualified views that survive bot + watch-time + geo + ICP-fit filters. Benchmark CPV across the FORKOFF KOL audit-ledger corpus is $0.04, which is 4x to 12x more cost-efficient than market median because the spend is gated to qualified delivery. The KOL audit-ledger is the wedge; the dollar number falls out of the gate.

Is the FORKOFF KOL benchmark the same as the $0.003 clipping rate?

No. $0.003 CPQV is the FORKOFF Clipping product floor and applies to /services/clipping only. KOL Marketing benchmark is $0.04 CPV, about 13x higher than clipping because KOL involves brand-fit screening, talent-rep negotiation, and content production, all of which carry per-engagement cost that bulk clipping does not. Both prices are real audit-ledger floors; they apply to different products.

Why does the model treat YouTube long-form as 4x the X baseline?

Production cost + dwell-time premium. A long-form YouTube video runs 8-25 minutes; production takes 12-40 hours; the audience dwell time is 5-15x a single tweet. The 4x multiplier is conservative against the production-cost ratio (often 8-12x at the same tier) and matches the 4-6x rate ratio in the FORKOFF audit ledger.

What if a creator's engagement rate is far below platform median?

Discount the tier by half a band. A 50k-follower X account with 0.4% engagement (vs the 1.5% platform median) prices like a Nano (1k-10k tier) for sponsored-post rate purposes. The calculator shows the headline tier price; manual discount applies if real engagement deviates by more than 30% from median.

Can the calculator handle multi-platform packages?

Run each placement separately and sum. A package quoted as one number across X + IG + YT obscures where the value is and lets the talent rep over-charge. Single-placement calculations let you compare cells head-to-head (X-thread vs IG-reel vs YT-short on the same creator) and negotiate per-piece.

Why is geo a 0.5x discount for SEA / LATAM?

Audience LTV. Brands buying SEA / LATAM impressions convert to revenue at 30-60% of the US / Tier-1 rate at the same conversion percentage because deal sizes and B2C ARPU are lower. The geo multiplier is the buyer-side adjustment, not a creator-side judgment. Same creator, different audience region, different price.

Does the calculator factor in usage rights or exclusivity?

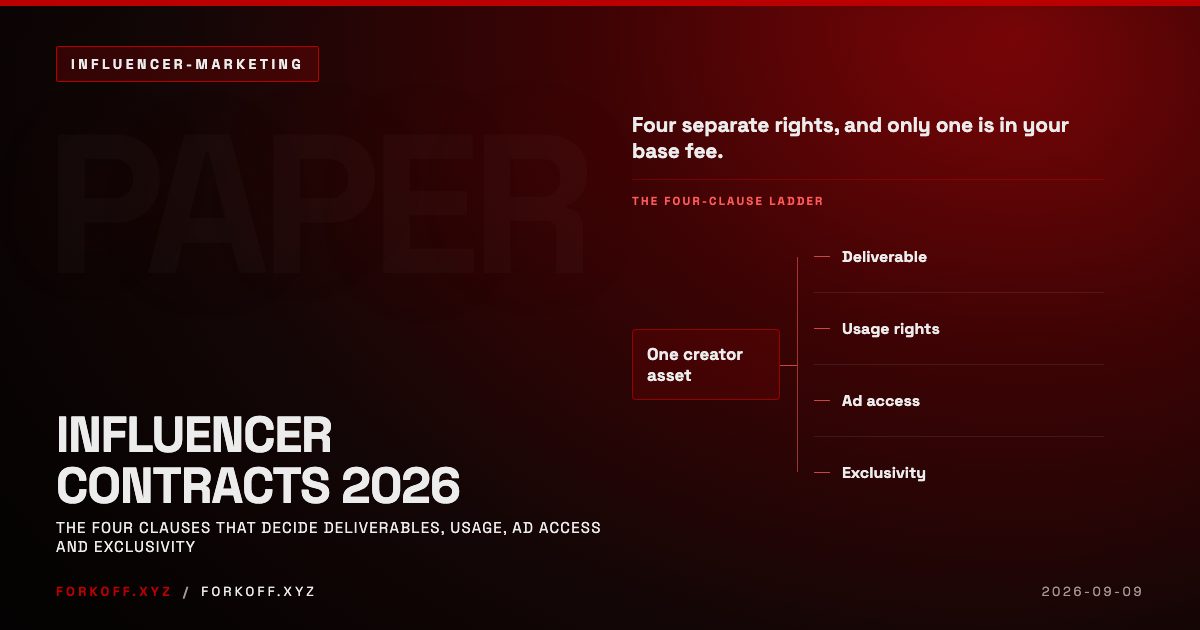
No. Whitelabel, paid-amplification rights, and exclusivity windows add 25-80% on top of the base rate, depending on the term. The calculator returns the placement-only rate; layer rights pricing on after.

What if my offer is rejected at the mid rate?

Two paths. (1) Negotiate up to high-band if the creator can show qualified-view delivery on the last 3-5 sponsored placements (real reach, not gross impressions). (2) Reroute the same dollars through the FORKOFF KOL audit-ledger model, same QV target, ledger billing, and skip the rate negotiation entirely.

How accurate are the rate ranges?

Mid is median-anchored against the FORKOFF KOL audit ledger (n=420+ managed placements, 18-month rolling). Low / high are 30th / 80th percentile. Per-cell standard deviation runs 22-48% (Crypto Mega highest, Consumer Micro lowest). Treat absolute numbers as median-anchored and ratios as more robust than any single value.

How does this connect to the FORKOFF KOL Marketing service?

The audit-ledger benchmark exposed in this calculator is the same model the managed engagement runs against. Brands typically run the calculator before negotiating, then route the qualified-view target through FORKOFF KOL Marketing for outcome-priced delivery. Free version exposes the math; managed version applies it to your live campaign.

Is the calculator free?

Yes. No signup, no email gate, no credit card. Run as many cells as you want. The managed FORKOFF KOL Marketing engagement is where the rate model becomes a real campaign with audit-ledger billing and weekly reporting.

The brand line

Stop pricing KOLs from a single dollar number.

5-axis rate range · qualified-view delivery · FORKOFF KOL audit-proof billing on the same campaign.

Run the calculator