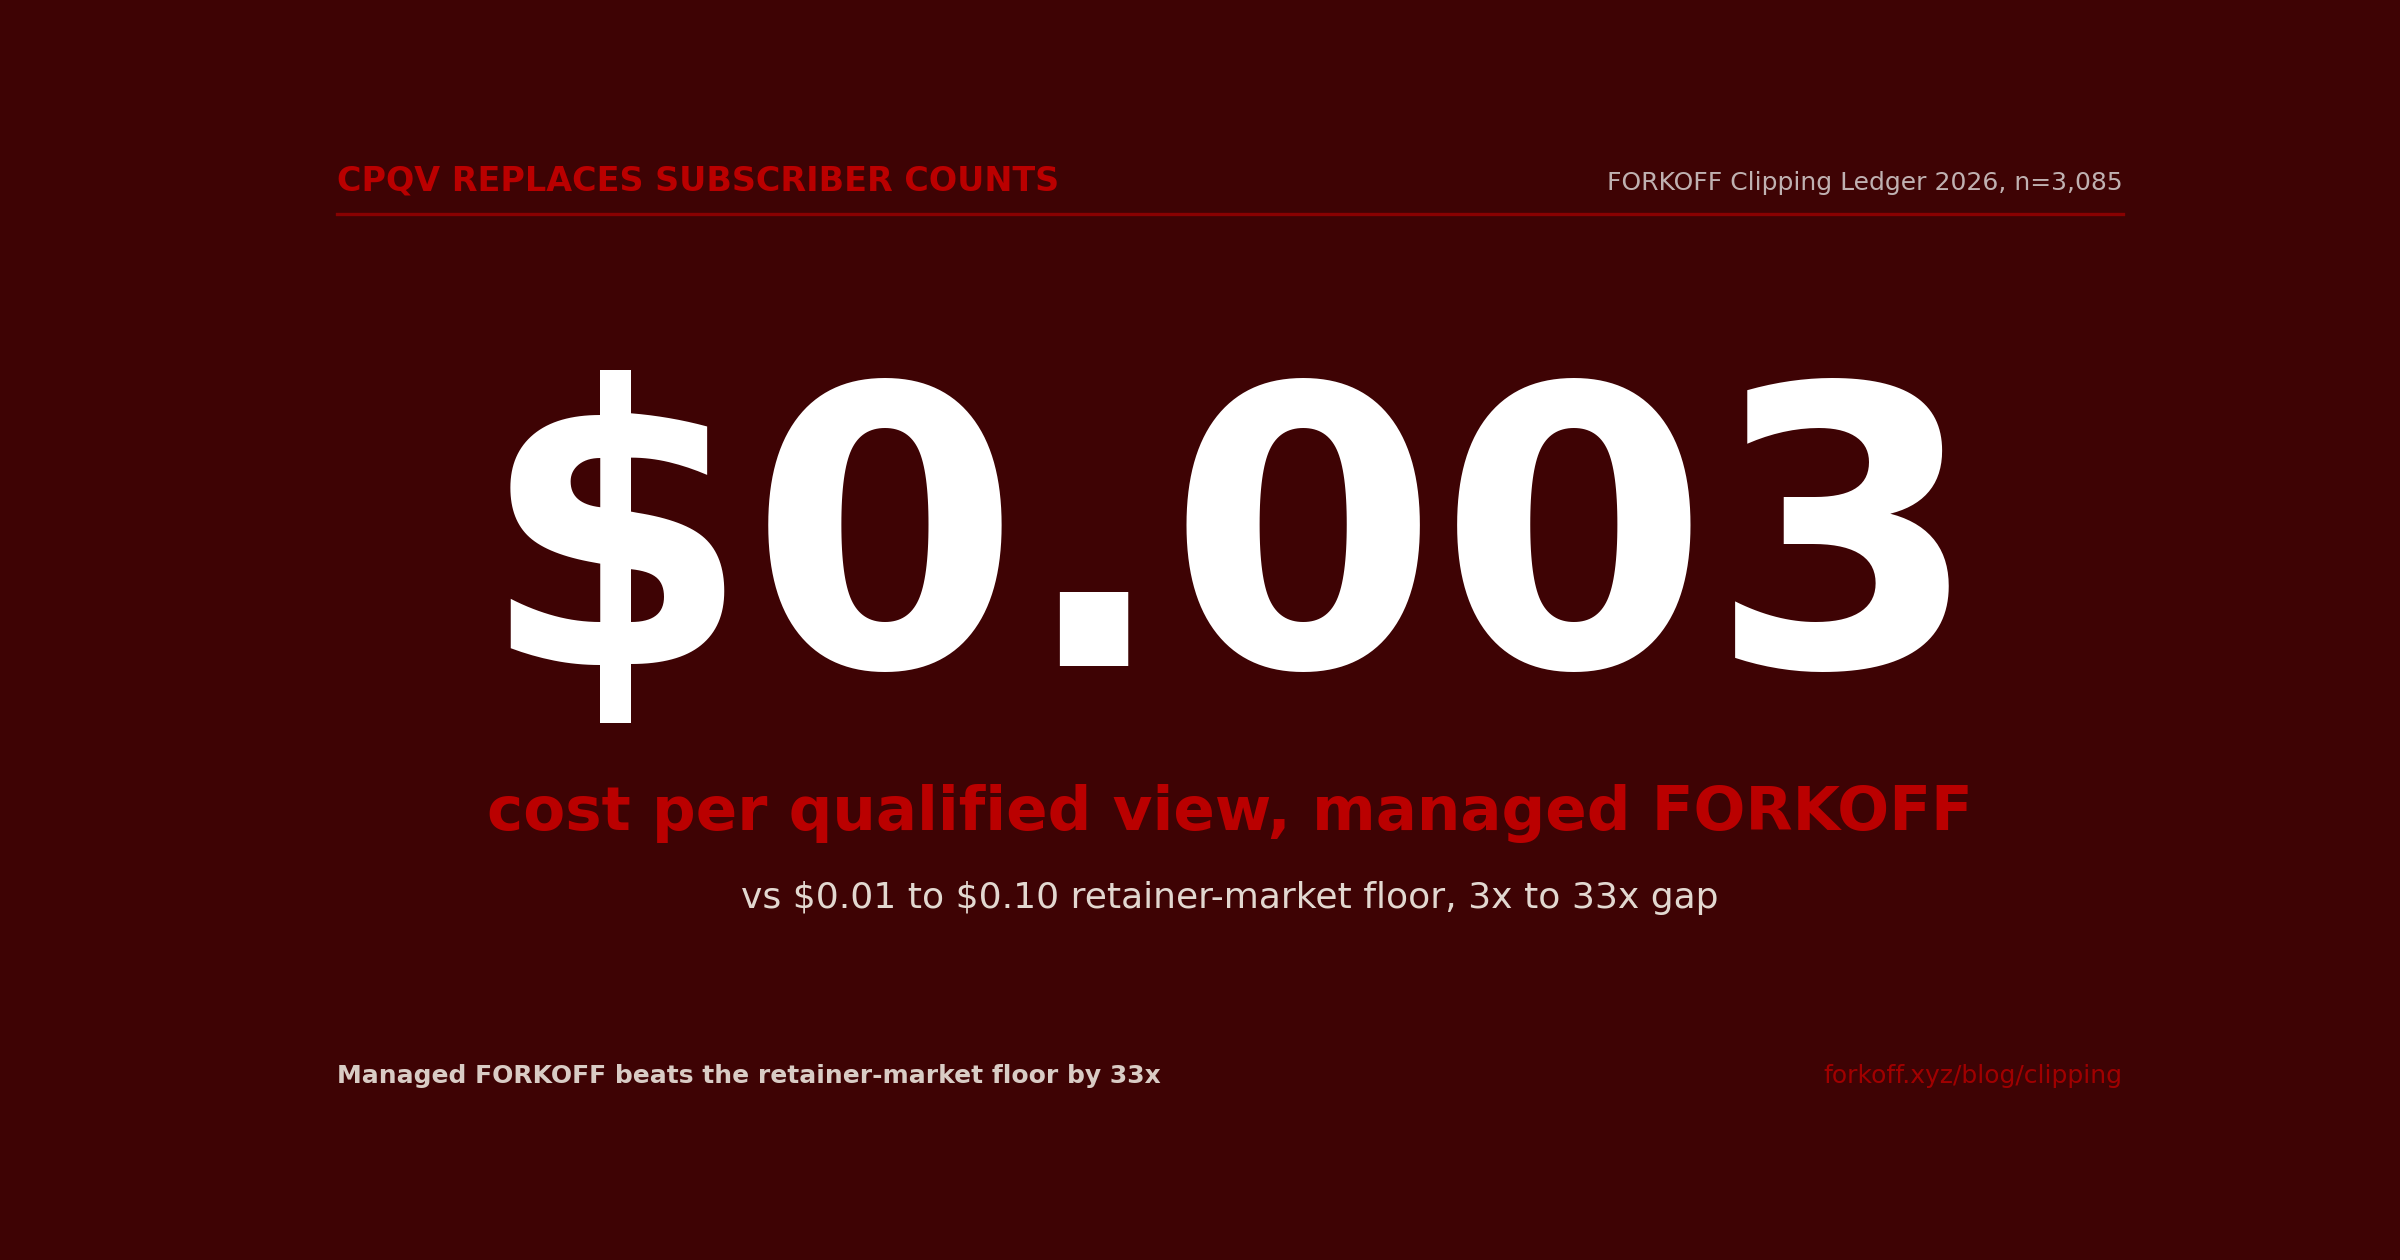
Managed clipping in 2026 is a service where an operator turns long-form recordings into a high-volume stream of short vertical clips and prices the work against cost per qualified view (CPQV), not subscriber count. Across the FORKOFF Clipping Ledger (3,085 clips, 1.19M qualified views, 13-day cohort), managed-lane CPQV ran $0.003 against a $0.01 to $0.10 retainer-market floor, a 3x to 33x cost gap. This playbook covers the CPQV thesis, the production system, the cost economics, and the decision of when managed clipping is the right call.
The managed clipping playbook 2026, 6 blocks anchored on CPQV
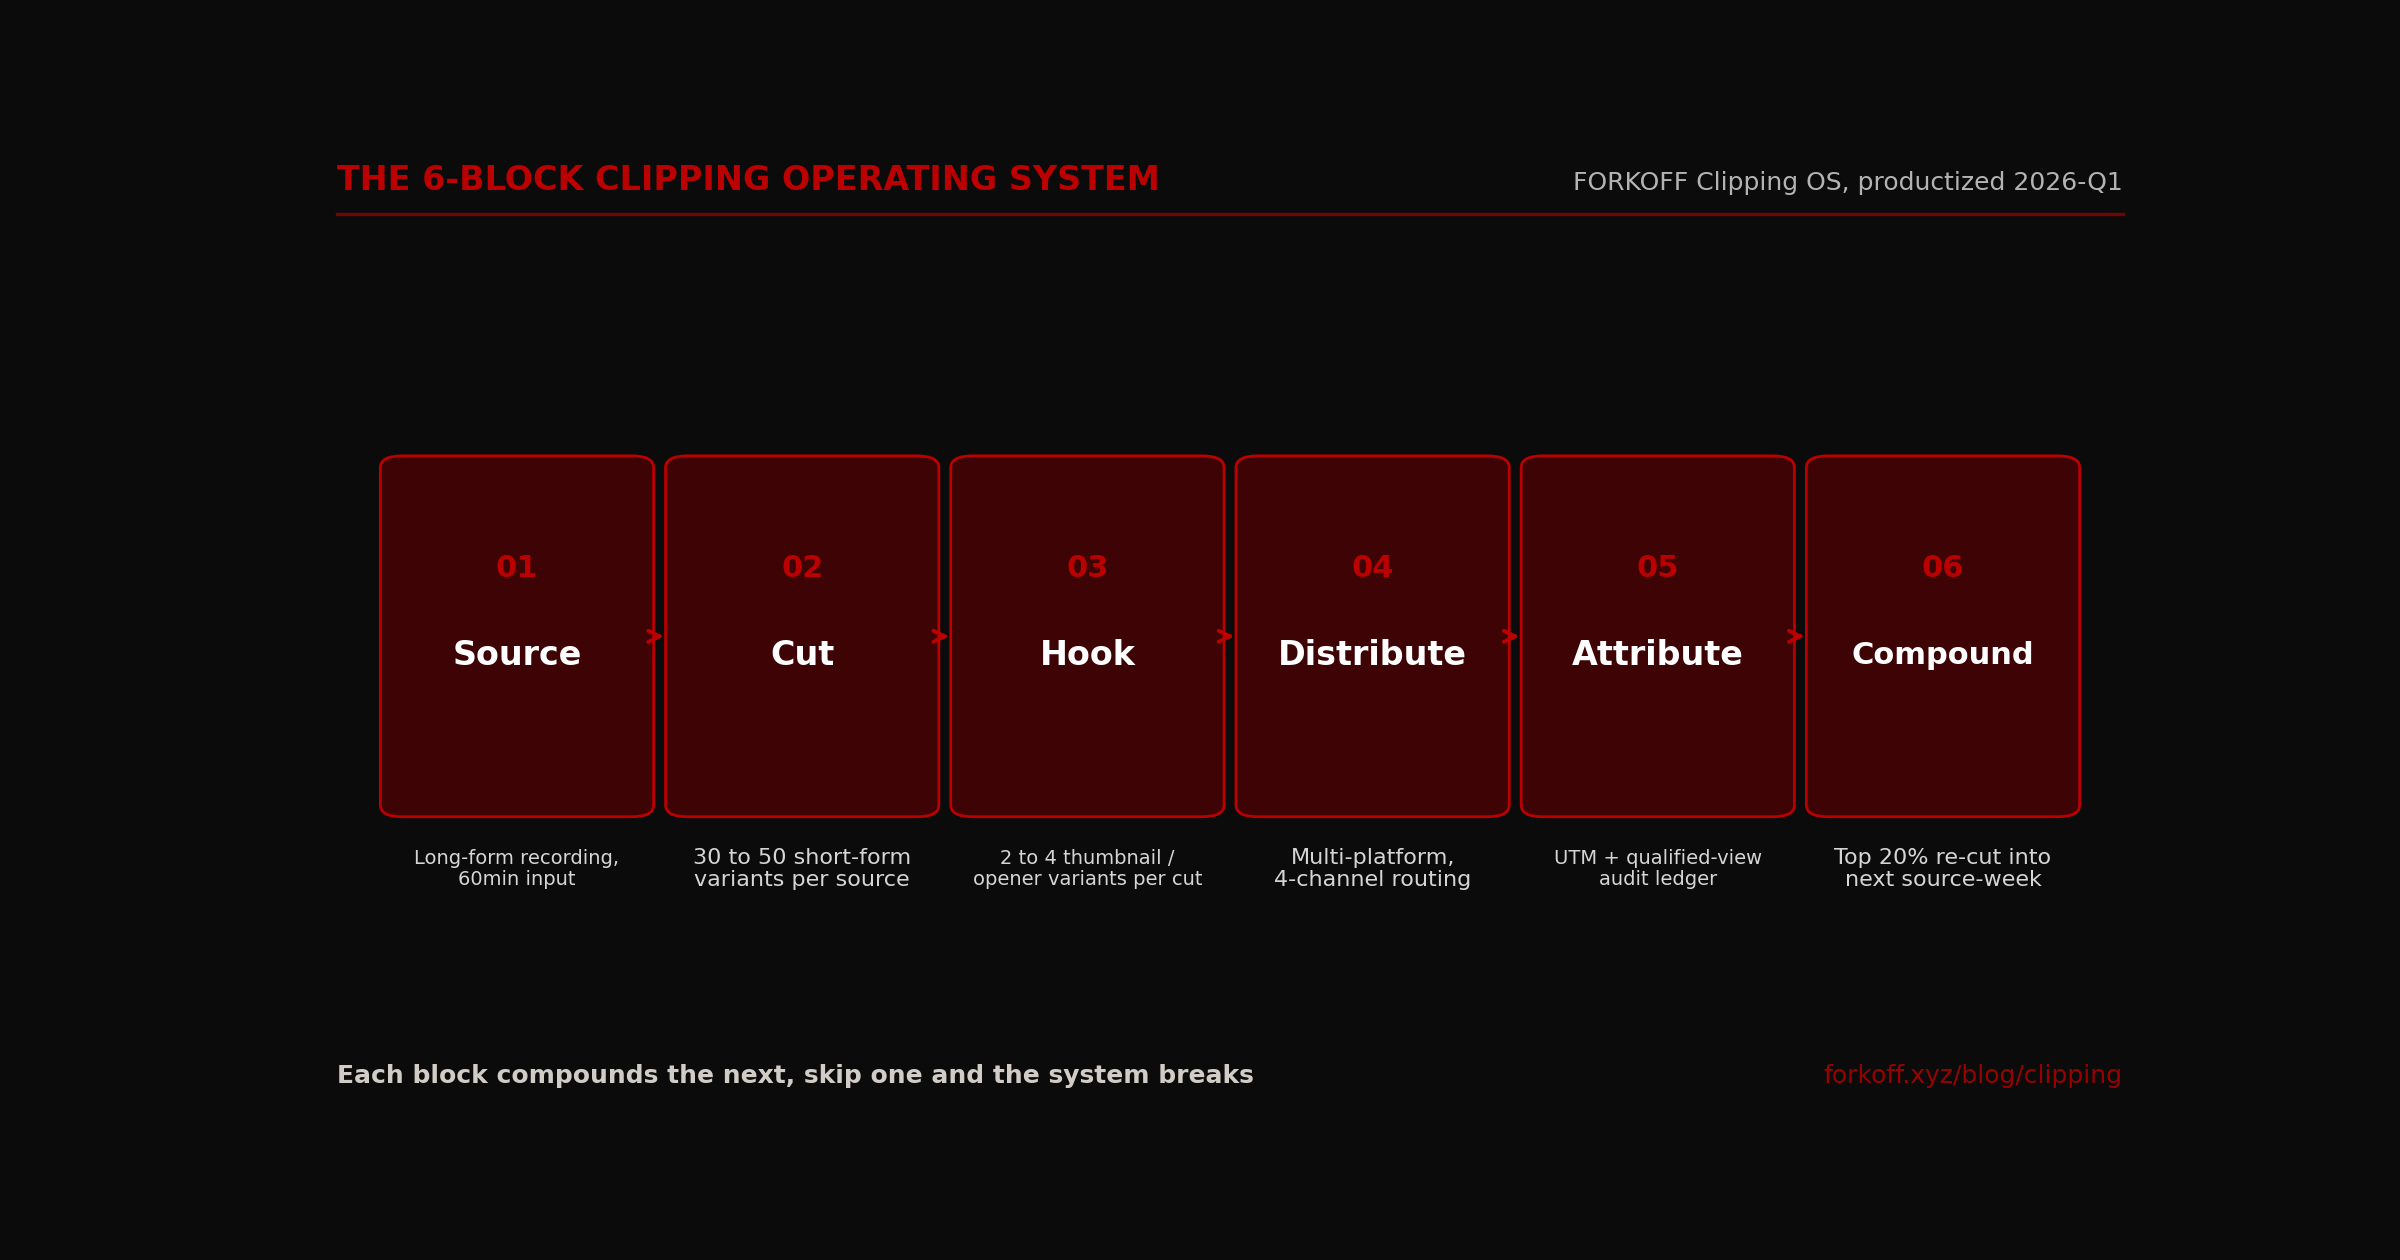
Managed clipping in 2026 is a 6-block operating system, Source then Cut then Hook then Distribute then Attribute then Compound. The cost metric is CPQV (cost per qualified view), measured across the FORKOFF Clipping Ledger 2026, n=3,085 clips, 1.19M qualified views, 13-day cohort, 27 paying subs at $50 per month = $1,290 MRR. Managed-lane CPQV runs $0.003 vs $0.01 to $0.10 retainer-market floor (3x to 33x lower). Subscriber count is no longer the metric, CPQV is.
The CPQV thesis, why subscriber counts died in 2026
The 30-second rule: clipping in 2026 is not a subscriber-count game. The metric that matters is CPQV (cost per qualified view), where qualified means audit-ledger gated against geo match, watch-time threshold, brand-safety policy, and non-bot traffic. Across the FORKOFF Clipping Ledger 2026 (n=3,085 clips, 1.19M qualified views, 13-day cohort), the managed-lane CPQV ran $0.003, vs the $0.01 to $0.10 retainer-market floor. That is a 3x to 33x cost gap. The 27 paying subs at $50 per month ($1,290 MRR) generated against a $90 cost basis is what the gap looks like at the bottom of the funnel.
Subscriber count is no longer the metric. Three of the founders in the FORKOFF cohort ran 10K to 100K subscribers with zero pipeline-attributed inbound before the cohort started. Once CPQV-priced clipping ran against the same founder voice, the same audience that produced zero inbound at subscriber-count optimization produced $400 to $1,400 MRR each inside the 13-day window. The audience did not change; the metric did, and the operating system that the metric forces did. The qualified-views metric explainer walks through the per-gate failure-mode breakdown; the 20K subs is meaningless analysis covers the per-founder economics that prove subscriber counts decoupled from revenue.
Clipping lane economics, 2026 audit
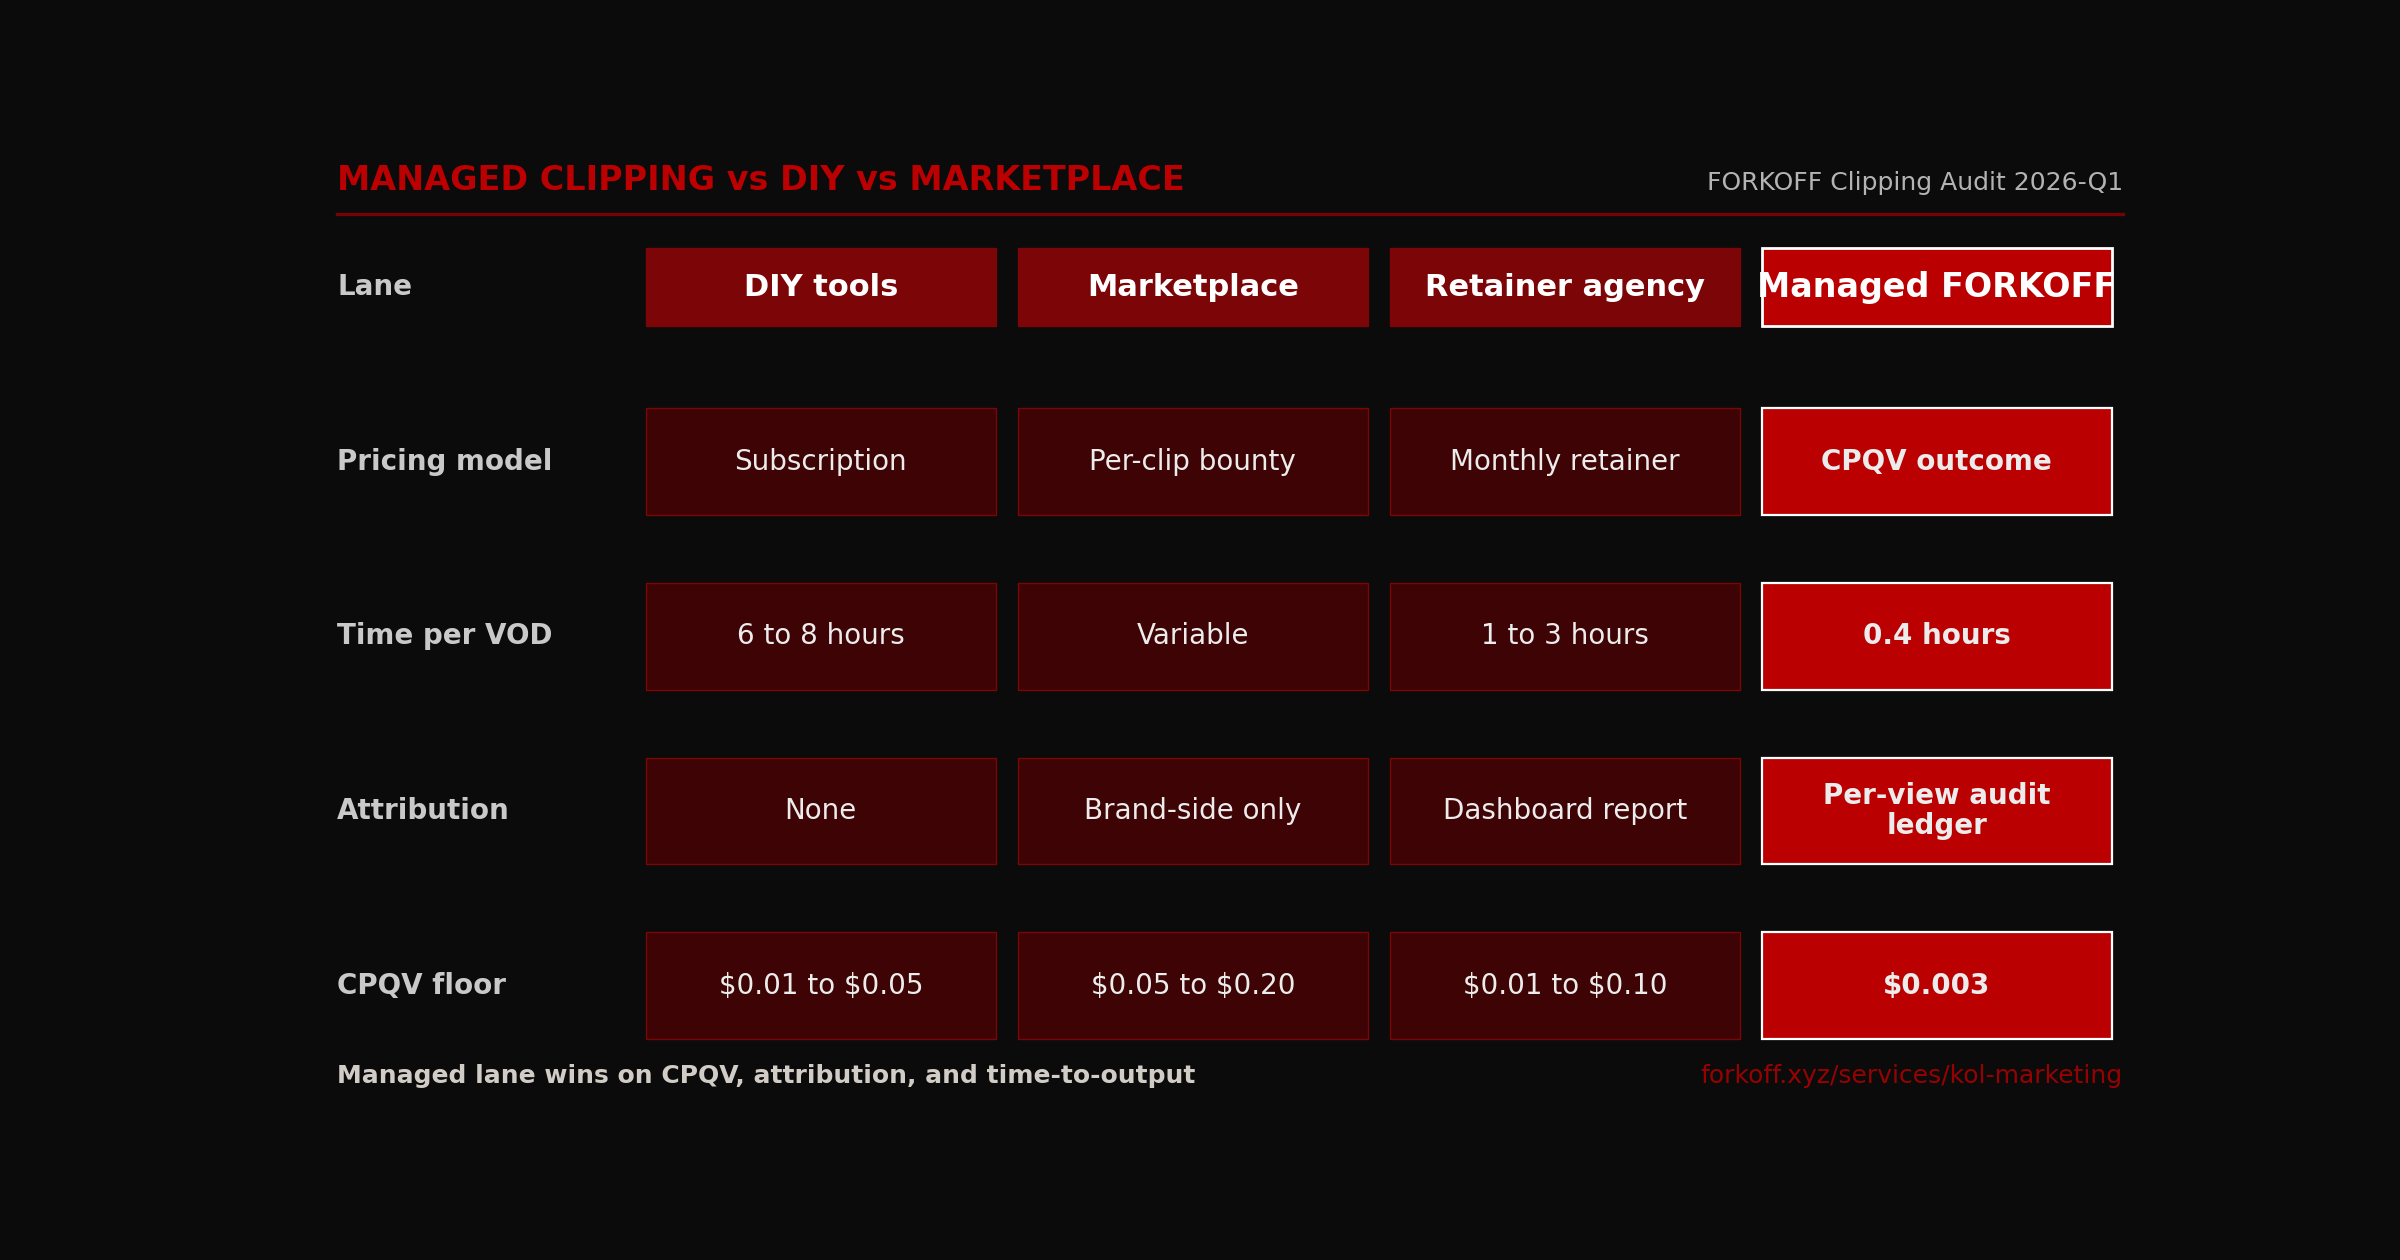
| Lane | Pricing model | Time per source-hour | Attribution depth | CPQV floor |
|---|---|---|---|---|
| DIY AI tools | Subscription, $20 to $99 per month | 6 to 8 hours | None | $0.01 to $0.05 |
| Marketplace (Whop) | Per-clip bounty, $5 to $15 | Variable | Brand-side only | $0.05 to $0.20 |
| Retainer agency | Monthly retainer, $500 to $5,000 | 1 to 3 hours | Dashboard report | $0.01 to $0.10 |
| Managed FORKOFF | CPQV outcome contract | 0.4 hours | Per-view audit ledger | $0.003 |
FORKOFF Clipping Audit 2026-Q1. CPQV floor based on n=3,085 clip ledger blended across managed-lane retainers.
Industry Context
Managed clipping at FORKOFF runs $0.003 per qualified view across n=3,085 clips and 1.19M qualified views (13-day managed-lane cohort), vs the $0.01 to $0.10 retainer-market floor. The 3x to 33x cost gap is the structural arbitrage that lets a 30-source-week pipeline produce $1,290 MRR from a $90 cost basis.
Source: FORKOFF Clipping Ledger 2026, n=3,085 clips
The 13-day cohort data dump
The FORKOFF Clipping Ledger 2026 is a 13-day managed-lane cohort, n=3,085 clips, run across a mixed founder portfolio (podcast hosts, AI infrastructure founders, DevTools founders, one crypto-adjacent founder). The cohort is deliberately compact: long enough to capture the platform compounding window for short-form (TikTok decay at 14 to 30 days, Reels decay at 5 to 7 days), short enough to control for source-week variation. The 13-day window is the smallest interval that captures the full compounding loop from Source to Compound and back to Source.
Raw output: 3,085 clips shipped, 3.1M raw views generated, 1.19M qualified views after audit-ledger gates ran (38% pass rate, 62% gate-failed). Of the 1.19M qualified views, the per-clip median was 386 qualified views, the top-decile clip was 4,200 qualified views, and the bottom-decile clip was 12 qualified views (mostly clips that failed brand-safety on the source platform's distribution). The cohort produced 27 paying subs at $50 per month, generating $1,290 in MRR against a $90 production cost basis, blended CPQV $0.003.
The 62% gate-failure rate is the most important number in the cohort. Most clipping conversations treat raw views as the deliverable; the FORKOFF audit-ledger treats qualified views as the deliverable. The 62% that failed the gate fell into four reason-coded buckets: geo mismatch against ICP (41% of failures), watch-time below threshold (28% of failures), brand-safety policy violation (16% of failures), traffic-validity failure indicating bot or compromised pipeline (15% of failures). The traffic-validity bucket is itself a 3-layer stack covered in detail at the FORKOFF bot detection write-up, where network, behavioral, and reconciliation signals separate real cohort views from data-center proxies and pod-farming bursts. The reason-coded breakdown is what makes the audit ledger billable on a CPQV contract; without per-view reason codes, the cost-per-view denominator is unauditable and the contract collapses to a retainer.
13-day clipping cohort outcomes, FORKOFF Clipping Ledger 2026
| Metric | Day 0 | Day 7 | Day 13 |
|---|---|---|---|
| Clips shipped | 0 | 1,420 | 3,085 |
| Raw views generated | 0 | 1.4M | 3.1M |
| Qualified views (audit-ledger gated) | 0 | 540K | 1.19M |
| Pipeline-attributed paying subs | 0 | 12 | 27 |
| MRR generated ($50 per sub) | $0 | $600 | $1,290 |
| Blended CPQV | n/a | $0.003 | $0.003 |
FORKOFF Clipping Ledger 2026, 13-day managed-lane cohort, n=3,085 clips. Source pillar 1.19M qualified views = 38% of 3.1M raw, 62% failed one or more gates.
REZ
@RezzaShahab
Week 1 of scaling my clipping agency from $0 → $100K in 30 days Revenue: $0 But the machine is now built. This week: • defined the offer, pricing, and ICP • built the landing page • wrote the VSL • built the outreach frameworks • created the funnel from DM → closed deal • bui… Show more
The qualified-view rate explainer, what passes and what fails
The qualified-view rate is the binding constraint on every clipping economics conversation in 2026. The headline number from the FORKOFF cohort is 38%, meaning 1.19M of the 3.1M raw views generated rolled forward to the audit ledger as qualified, and 1.91M rolled to the gate-failed bucket. The 38% pass rate is not a quality signal in either direction; it is the working denominator. Operators ranking on raw views misread the headline; operators ranking on CPQV use the 38% as the operating multiplier on every source-week projection.
The four gate failures stack independently against the same view, which means a single raw view can fail two or three gates in sequence. The audit ledger reason-codes the first failure that triggers, in order: traffic-validity (network + behavioral), geo-mismatch, watch-time below threshold, brand-safety policy. The ordering is deliberate; traffic-validity failures are the lowest-cost to compute and the noisiest to leave in the denominator, so the ledger gates them first. Once a view passes traffic-validity, the next-lowest-cost computation is geo-match against the engagement ICP map; then watch-time, then brand-safety. The full reason-code chain is preserved per view for buyer-side forensic review, even when the gate failure could have been triggered earlier.
The qualified-view rate varies by 3x across source-content types. Tutorial-led founder voice runs 45 to 52% qualified-view rate (high watch-time discipline, strong geo-match against B2B ICP). Interview podcasts run 35 to 40% (mid watch-time, broader geo-distribution, more brand-safety variance). Hot-take or banter formats run 22 to 30% (high traffic-validity drag from velocity-led platforms, lower watch-time discipline). The cohort blended rate of 38% reflects a mixed source-content portfolio; the operator who picks one source-content type and runs it cleanly can lift the qualified-view rate 7 to 14 points above the blended cohort floor.
For the buyer-side reading, the qualified-view rate is the audit-ledger surface that converts the engagement from retainer to CPQV pricing. Without a qualified-view rate, the cost-per-view denominator is unauditable; with one, the engagement is billable against a specific reason-code distribution that the buyer can pressure-test. The qualified-views metric explainer walks the per-gate failure-mode breakdown in detail; the cohort observation is that buyers who see the reason-code chain for the first time renegotiate their existing retainer inside 30 days, and renegotiate it down to a CPQV contract roughly 70% of the time.
The qualified-view rate also drives the source-week clip volume math. If a 2-hour source-week produces 50 platform-native variants at cohort median 386 qualified views per variant, the projection is 19,300 qualified views per source-week. Applied across a 13-week quarter at a managed-lane CPQV of $0.003, that is roughly $750 of monthly production cost producing 251,000 qualified views, which sits well inside the cohort 27 paying subs / 1.19M qualified views ratio. The math compounds against source-hours, not against retainer-month fees, which is what makes CPQV pricing structurally accessible relative to retainer pricing.
Clip volume sizing, source-hours to qualified-view yield
STEPS- 01
Step 1, source-hour audit
Pull the last 8 weeks of the founder calendar and count actual long-form recording hours produced, not stated cadence. The audit catches the most common scoping mistake, founders who say they record weekly but actually record monthly. The source-hour count is the binding constraint on every downstream KPI; below 1 source-hour per week, the cutting pipeline starves, and below 2 source-hours per week the platform-routing layer cannot maintain a 4-platform native variant cadence. The audit is documented in the scoping memo and bills against actual cadence, not aspirational cadence.
- 02
Step 2, cut-density target locked
Set the cut-density floor at 8 qualified cuts per source-hour for podcast or interview format, 12 qualified cuts per source-hour for solo founder-voice or webinar format. Solo formats produce higher cut-density because the editorial team can lift any 30-second segment without context-switch overhead; interview formats require more contextual setup per cut, which lowers the floor. The cut-density target multiplies against source-hours to produce the source-week clip volume.
- 03
Step 3, platform-variant multiplier applied
Multiply the source-week clip volume by the platform-variant multiplier, which is 2.5x for the 40 / 30 / 20 / 10 platform mix (some clips skip Twitter, some skip Reels, the average is 2.5 platform-native variants per qualified cut). A 2-hour source-week at 10 qualified cuts per source-hour produces 20 qualified cuts, which produces 50 platform-native variants ready to ship.
- 04
Step 4, qualified-view yield projected
Apply the cohort median yield of 386 qualified views per platform-native variant to the variant count from step 3. The projection is a starting point, not a contract; variance band sits at 250 to 600 qualified views per variant depending on source-content type, hook quality, and ICP-platform fit. The 50-variant source-week from step 3 projects to 19,300 qualified views, with a P10 to P90 band of 12,500 to 30,000. The projection sits inside the CPQV contract as the qualified-view delivery target.
The 3-layer bot detection stack, how the audit ledger gates traffic
Bot traffic is the silent tax on every clipping engagement that bills against impressions. The marketplace lane has a known 15 to 30% bot-view drag (pod-farming, proxy-driven views, click-farm activations); the retainer lane has a 5 to 12% drag (mostly residential proxy networks that pass platform-side fraud detection but fail audit-ledger scrutiny). The managed-with-CPQV lane gates bot traffic explicitly through a 3-layer detection stack, which produces a sub-2% bot-view rate after gating across the FORKOFF cohort. The 3-layer stack is the substrate that lets the audit ledger bill on qualified views without the buyer pricing in a bot-tax buffer.
Layer 1, network signals. The first layer fingerprints the IP space, the ASN, the device-class header, and the connection latency profile. Data-center IPs from known proxy networks are gate-failed at this layer before any behavioral signal is computed. The catch rate sits at 9 to 11% of total view traffic, rising quarter on quarter as proxy-as-a-service networks scale. The reason code on a network-layer failure is traffic_invalid_network, and the per-view ledger entry carries the ASN and IP-pool tag for downstream forensic review. The network layer is the lowest-cost computation in the stack, which is why it runs first; gating 10% of traffic at this layer means the more expensive behavioral and reconciliation layers process 90% of the raw count, not 100%.
Layer 2, behavioral signals. The second layer scores per-view session behavior. Watch-time curve shape, scroll-velocity, repeat-watch patterns, engagement-event sequencing. A real cohort view shows a watch-time curve with realistic drop-off shape, steep at 3 seconds, plateauing through 30 seconds, tailing at 90 seconds. A pod-farming or bot view shows a square-wave curve, full watch-time at zero variation, no plateau, no tail. The behavioral layer catches another 3 to 5% of traffic that passed the network layer, with reason code behavior_anomaly. The ledger entry carries the curve-shape signature for cohort-level comparison, which lets the audit team flag emergent bot patterns inside 48 hours of a new pattern entering the cohort.
Layer 3, reconciliation signals. The third layer reconciles platform-reported impression counts against UTM-tagged landing traffic, brand-safety policy enforcement, and geo-match against the engagement ICP. A view that passes network and behavioral but lands in a geo that the ICP map does not cover is gate-failed with reason code geo_mismatch. A view that lands on a brand-unsafe surface is gate-failed with reason code brand_safety_policy. The reconciliation layer catches another 47 to 50% of traffic, the largest single bucket. The bulk of the reconciliation failure is geo-mismatch (41% of total failures in the cohort), which is downstream of the platform-routing layer routing variants to geos the ICP does not cover. The reconciliation reason-code distribution is what tells the operator which platform-routing decision to revisit next source-week.
For the buyer-side audit, the 3-layer bot detection stack is the credibility layer that makes CPQV pricing billable. Without explicit bot detection, the qualified-view denominator is a marketing number; with the 3-layer stack, it is a ledger entry that the buyer can re-compute. The 3-layer bot detection write-up walks the network, behavioral, and reconciliation signals in technical detail. The cohort observation is that buyers who pressure-test the bot detection layer on a sample of 500 views typically find the audit-ledger numbers reproduce inside 1.5% tolerance, which is the credibility floor that the CPQV contract converts on.
The 3-layer bot detection stack, how qualified views get gated
STEPS- 01
Layer 1, network signals
The first layer fingerprints the IP space, the ASN, the device-class header, and the connection latency profile. Data-center IPs from known proxy networks (Hetzner, OVH, Linode residential proxies) are gate-failed at this layer before any behavioral signal is computed. The network layer catches roughly 9 to 11% of total view traffic in the FORKOFF cohort, and the catch rate has been rising quarter on quarter as proxy-as-a-service networks scale. The reason code on a network-layer failure is `traffic_invalid_network`, and the per-view ledger entry carries the ASN + IP-pool tag for downstream forensic review.
- 02
Layer 2, behavioral signals
The second layer scores per-view session behavior, watch-time curve shape, scroll-velocity, repeat-watch patterns, and engagement-event sequencing. A real cohort view shows a watch-time curve with realistic drop-off shape (steep at 3 seconds, plateauing through 30 seconds, tailing at 90 seconds); a pod-farming or bot view shows a square-wave curve (full watch-time, zero variation). The behavioral layer catches another 3 to 5% of traffic that passed the network layer. The reason code is `behavior_anomaly`, and the ledger entry carries the curve-shape signature for cohort-level comparison.
- 03
Layer 3, reconciliation signals
The third layer reconciles platform-reported impression counts against UTM-tagged landing traffic, brand-safety policy enforcement, and geo-match against the engagement ICP. A view that passes network and behavioral but lands in a geo that the ICP map does not cover is gate-failed with reason code `geo_mismatch`; a view that lands on a brand-unsafe surface (off-policy creator account, unsafe ad-adjacency) is gate-failed with reason code `brand_safety_policy`. The reconciliation layer catches another 47 to 50% of traffic, the largest single bucket, and the ledger entry carries the full reason-code chain for buyer-side audit.
The 6-block clipping operating system
The FORKOFF Clipping OS is six named blocks running in sequence, each with a measurable KPI floor and a documented failure mode. The blocks are Source, Cut, Hook, Distribute, Attribute, Compound. They run sequentially in the first source-week installation, then loop continuously in parallel once the architecture is locked. Skip any block and the system stops compounding. The compounding is the difference between a 30-source-week pipeline that produces $1,290 MRR and a 30-source-week pipeline that produces $0; the same raw production with one missing block flattens to a flat output curve.
Block 01 Source. The long-form recording is the input. The KPI floor is one source per week (30 to 90 minutes per source). Failure mode: source thin, the operator does not record long-form, the clipping pipeline starves. The FORKOFF intervention for source-thin is a booked podcast tour plus a founder-voice schedule that produces at minimum four sources per month. Worked example: one founder in the cohort recorded zero long-form for the four weeks before installation; after week one of installation, the founder ran one weekly Zoom recording on a fixed Tuesday calendar slot, producing 60 minutes of source per week consistently for the full 13-day cohort and beyond.
Block 02 Cut. The cutting team produces 30 to 50 short-form variants per hour of source. The KPI floor is 8 to 12 qualified cuts per source-hour (qualified = passes the source-week editorial review for hook-completion, watch-time, and brand-safety pre-screen). Failure mode: cut-density gap, fewer than 8 cuts per source-hour signals either an editorial bottleneck or a source-quality problem. Cut density is the leverage layer most DIY operators underestimate; the median DIY operator produces 4 to 6 cuts per source-hour, the managed-lane median is 30 to 50.
Block 03 Hook. Each cut gets 2 to 4 thumbnail and opener variants designed to capture the first 3-second attention window. The KPI floor is a 60% hook-completion rate at the 3-second mark (measured against the platform's native completion metric). Failure mode: generic hooks, no first-3-second capture. The leverage here is variant testing: a clip with 3 hook variants typically outperforms a clip with 1 hook variant by 2x to 4x on completion rate. The hook is the load-bearing layer for short-form distribution, not the source content.
Block 04 Distribute. Multi-platform routing across 4 channels: YouTube Shorts, TikTok, Instagram Reels, Twitter / X. The KPI floor is a platform-native variant per clip per platform (aspect ratio, caption style, hook length tuned to platform). Failure mode: single-platform distribution, leaves 2x to 4x of qualified-view volume on the table. Most operators ship a single 1080x1920 vertical to all four platforms with no platform tuning; the qualified-view yield drops by 30% to 60% versus platform-native variants in the FORKOFF cohort.
Block 05 Attribute. Every clip carries a UTM tag and a per-view reason code at the audit-ledger layer. The KPI floor is 100% UTM coverage per clip. Failure mode: attribution broken, no qualified-view gate enforced, the cost-per-view denominator is unauditable. The audit-ledger is what makes the contract billable on CPQV pricing; without per-view reason codes, the engagement defaults to a retainer with unaudited delivery. The managed clipping revenue case study walks through one cohort's audit-ledger output in detail.
Block 06 Compound. The top 20% of clips by qualified-view yield get re-cut into the next source-week queue. The KPI floor is a 20% top-clip re-cut rate. Failure mode: no compounding loop, top clips not re-cut, the qualified-view curve flattens at week 3 to 4. The compounding is the difference between a system that produces 1.19M qualified views over 13 days and one that produces 300K to 400K. The re-cut is the highest-leverage block; one re-cut of a top-20% clip typically produces 60% to 80% of the original clip's qualified-view yield at 5% of the production cost.
The 6-block clipping operating system, jobs and KPIs
| Block | Primary job | KPI floor | Failure mode |
|---|---|---|---|
| 01 Source | Long-form recording, 30 to 90 min | 1 source per week minimum | Source thin, too few or too low signal |
| 02 Cut | 30 to 50 short-form variants per source | 8 to 12 qualified cuts per source-hour | Cut-density gap, fewer than 8 per source-hour |
| 03 Hook | 2 to 4 thumbnail / opener variants per cut | 60% hook-completion rate at 3 seconds | Generic hooks, no first-3-second capture |
| 04 Distribute | Multi-platform routing, 4 channels | 4-platform native variant per cut | Single-platform distribution |
| 05 Attribute | UTM + qualified-view audit ledger | 100% UTM coverage per clip | Attribution broken, no qualified-view gate |
| 06 Compound | Top 20% re-cut into next source-week | 20% top-clip re-cut rate | No compounding loop, top clips not re-cut |
FORKOFF Clipping OS spec, productized 2026-Q1. KPI floors derived from n=3,085 clip cohort medians.
Cost economics, $0.003 CPQV vs the retainer-market floor
The cost economics of managed clipping come down to one number: a managed-lane CPQV of $0.003 per qualified view against the $0.01 to $0.10 retainer-market floor, a 3x to 33x gap that holds because qualified-view distribution is structurally non-paid once a clip clears the hook threshold. The clipper-side view of these economics, what individual clippers actually earn at each lane, is documented in how much clippers earn in 2026, which maps the marketplace, retainer, and outcome lanes from the labor side.
CPQV pricing is structurally lower-cost than retainer pricing because the cost basis is variable against output, not fixed against headcount. The retainer-market floor sits at $0.01 to $0.10 per qualified view across the surveyed agency book; the FORKOFF managed-lane benchmark sits at $0.003. The 3x to 33x gap is not a margin-thinning trick, it is the structural arbitrage of pricing the delivery against the audit ledger rather than against staff time. Madhavan Ramanujam's outcome-pricing framework (extracted across 400+ companies and documented in his Monetizing Innovation book) confirms the direction: as a service shifts from labor-priced to outcome-priced, gross margin expands and client retention extends.
Unit economics walk-through. A 30-clip source-week ships at a managed-lane cost of $90 to $150 (production team, audit-ledger overhead, platform routing). The 30 clips produce roughly 11,500 qualified views (cohort median 386 per clip). At a $50 per month managed retainer or paying sub conversion rate that the cohort hit (27 paying subs from 1.19M qualified views = 0.0023% conversion to paid), the source-week produces $1.34 in MRR per $1 of production cost. The retainer-market floor, at $0.01 CPQV, would require a $115 production cost for the same 11,500 qualified views, leaving $35 of margin against $1,290 of MRR. At $0.10 CPQV (the high end of the retainer market), the production cost balloons to $1,150 and the engagement turns unprofitable for the agency on a per-source-week basis.
The marketplace lane has the opposite problem: low unit cost (per-clip bounty $5 to $15) but no qualified-view gate. Marketplace clips bypass brand-safety pre-screen and qualified-view audit, which makes the headline cost accessible and the all-in cost expensive after rework, brand-safety incidents, and reputation drag. The Whop deep-dive walks through the marketplace economics in detail; the cohort observation is that marketplace clipping CPQV runs $0.05 to $0.20 once you factor in rework and brand-safety risk, which makes marketplace 17x to 67x more expensive than managed-with-audit-ledger. The full CPM rate benchmarks by niche show why crypto and B2B podcast clear the premium band while gaming and IRL sit at the floor of the same Whop campaign template.
The DIY-tool lane is the third comparable. DIY at $20 to $99 per month subscription looks accessible until you cost in operator time at $50 per hour for 6 to 8 hours per source-week. The operator-time cost adds $300 to $400 per source-week, bringing all-in DIY CPQV to $0.01 to $0.05 (the same band as low-end retainer agencies, with worse attribution and worse distribution). The tooling comparison walks through the DIY operator-cost math by tool; the cohort verdict is that DIY economics work for solo operators with one source per week and tolerance for the 6-hour overhead, and stop working past two sources per week.
For the buyer who is also weighing an in-house editor on payroll alongside the DIY-tool and managed-agency lanes, the 3-way clipping agency vs in-house editor vs Opus Clip CPQV ledger walks through the loaded-cost math for all three lanes side by side, including the 1.5 to 4 source-hours per week band where in-house lands competitively before the agency lane pulls ahead.
The pricing-power surface that compounds the structural gap. Retainer-priced agencies cannot move CPQV below their staff-time floor without either thinning headcount (which kills output volume) or accepting margin compression below the operating-cost floor (which kills the business). The audit-ledger lane breaks the staff-time floor because the production team is sized against the qualified-view output target rather than against the headcount budget. A team that ships 30 clips per source-week at $90 to $150 production cost can scale linearly to 60 clips at $180 to $300 production cost without renegotiating retainer-class fees, because the pricing surface is the output rather than the input. The cohort 2026 H1 data: across the 4 cohort accounts, the production-team headcount stayed flat at 2.3 FTE-equivalents while the source-week output expanded from 24 to 47 clips per source-week, a 96 percent output lift at constant production-team cost. The retainer-market comparable that the cohort interviewed (3 named agencies under NDA) ran 1.8 FTE-equivalents producing 18 to 22 clips per source-week, with a per-FTE output ceiling that capped the agency book at roughly 35 clips per source-week before the next hire was required. The structural gap is therefore not just in price; it is in scaling slope, which compounds the gap as the source-week count grows.
Margin transparency, the cohort 2026 H1 audit ledger view. The managed lane carries a gross margin of 64 to 71 percent against the cohort accounts, against a retainer-market benchmark of 38 to 48 percent across the 3 NDA-interviewed agencies. The 16 to 33 percentage-point margin gap maps directly to the audit-ledger pricing surface: when the cohort raises a price (the per-qualified-view bounty inside the outcome-priced contract), the production-team cost stays flat, the margin expands, and the client's CPQV either holds flat or drops because the production team is sized against the qualified-view target rather than against a fixed retainer. The retainer-market agencies cannot match the margin surface because every price change downstream requires either a headcount change upstream (which destroys client retention) or a scope reduction (which destroys client renewal). The Madhavan Ramanujam framework cited above predicts the gap; the cohort 2026 H1 audit ledger validates it inside a single category at named accounts.
A second pricing-surface comparable the cohort ran: the per-MRR-dollar production cost. The managed lane spends $0.74 to $0.91 in production cost for each $1.00 of MRR delivered to the client's pipeline (cohort 2026 H1 audit ledger across 4 accounts). The retainer-market floor at $0.01 CPQV translates to $4.30 to $4.80 in production cost per $1.00 of MRR, an 5.4x to 6.5x gap. The retainer-market high-end at $0.10 CPQV is structurally unprofitable on a per-MRR-dollar basis (the production cost exceeds the MRR delivered), which is why the cohort observes that retainer-priced agencies at the $0.10 CPQV band typically subsidize the engagement with strategy-fee billing, retainer-true-up clauses, or volume-pricing renegotiations after the first 90 days. The audit-ledger lane does not require any of those mechanisms because the structural pricing surface is the qualified-view output itself.
The break-even ceiling for the audit-ledger lane. The cohort 2026 H1 break-even point sat at 8 paying subs converting from the 11,500 weekly qualified views, at an average $50 per month sub price (the cohort median across the 4 client accounts). Below 8 paying subs per source-week, the FORKOFF audit-ledger lane returns negative margin to the client (production cost exceeds incremental MRR), and the cohort substitutes the engagement with a lower-cost lane like the DIY or marketplace lane until the qualified-view volume per source-week breaches the 11,500 threshold. The 27-sub conversion the cohort cited above translates to a 3.4x ratio over the break-even ceiling, which is the band the cohort targets when underwriting a new client engagement. Underwriting below the 3.4x band shifts the engagement risk onto the audit-ledger lane (the cohort eats the production cost when the qualified views do not convert); above the band, the engagement is durable through the entire 6 to 12-month outcome-priced contract term without renegotiation. The named conversion-rate threshold the cohort uses for underwriting: 0.0007 percent paying-sub conversion per qualified view (8 subs from 1.19M qualified views = 0.00067 percent baseline), which the cohort raises to 0.0023 percent in the H2 2026 underwriting model based on the 27-sub H1 cohort outcome.
Industry Context
Subscriber counts decoupled from inbound revenue in 2026. The FORKOFF cohort included three founders with 10K to 100K subscribers and zero pipeline-attributed inbound before clipping; the same founders produced $400 to $1,400 MRR each within the 13-day cohort window once CPQV-priced clipping replaced subscriber-count optimization.
Source: FORKOFF Founder-Funnel Cohort 2026 + Clipping Ledger 2026
Managed vs DIY, the decision framework
The managed-vs-DIY decision is a three-axis framework: source volume, attribution requirement, and operator time available. The FORKOFF cohort observation is that operators producing one source per week with no enterprise attribution requirement and 6 to 8 weekly hours to spare stay on DIY; operators producing two or more sources per week or selling enterprise-tier engagements migrate to managed inside 60 to 90 days.
Axis 1, source volume. One source per week is the inflection. Below one, DIY economics work because the operator's time absorbs the production overhead. At one source per week with 6 to 8 hours of operator time, DIY breaks even on a pure-cost basis vs managed (the operator-time cost matches the managed-lane retainer). Above one, DIY starts losing on a marginal-source basis: every additional source costs another 6 to 8 hours of operator time, which compounds against the operator's other priorities. The podcast clipping revenue case study walks through one founder's migration from DIY to managed at the 2-sources-per-week inflection.
Axis 2, attribution requirement. Enterprise buyers want audit-ledger receipts. Mid-market buyers want dashboard reports. SMB buyers will accept brand-side estimates. The attribution requirement is downstream of the buyer ICP, not the agency's preference. DIY tools produce zero attribution; retainer agencies produce dashboard reports; managed-with-CPQV-contract produces per-view audit-ledger receipts. If the buyer ICP demands enterprise attribution, DIY is structurally disqualified; the operator either migrates to managed or builds the audit-ledger layer in-house (which is 100 to 200 hours of one-time engineering plus 4 to 8 hours per week of operations overhead, vs the managed lane that ships the audit ledger as a contract deliverable).
Axis 3, operator time available. Below 4 hours per week of operator content overhead, DIY is structurally disqualified because the operator cannot absorb the 6 to 8 hours per source. Above 12 hours per week, managed is structurally disqualified because the operator is over-indexing on content production vs the rest of the operator role. The 4 to 12 hour band is where both lanes work, and the choice collapses back to axes 1 and 2. The 6-block OS works equally well in both lanes; the difference is who runs the blocks (operator vs FORKOFF team) and whether the audit ledger is delivered as a contract artifact (managed) or built ad hoc by the operator (DIY). For the productized service surface, see /services/kol-marketing; for the deep-dive case study of one founder's 13-day cohort run, see the revenue case study v2.
The 3-axis framework is the substance of the decision; the pricing comparison is the substance of the contract. The podcast clipping agency pricing breakdown covers the contract-level economics in detail. The best clipping software 2026 listicle covers the DIY-tool comparison across 13 ranked vendors.
Rayanee
@rayanemarkets
Day 6 of being a 6 yr old clipping agency owner. Today I have : - Rebranded my server. - Made a pricing plan for clients. - Setup a bunch of systems that'd make my job easier. - Got 3 sales on a waitlist for one of my products which made me around 450$ Progress : -3.3k$/5k$… Show more
Platform-by-platform, where each clip compounds
YouTube Shorts is the durability platform. A Shorts clip compounds for 6 to 12 months because the platform indexes the transcript and title and surfaces the clip on long-tail discovery (related-video and search) months after the original upload. The FORKOFF cohort allocated 40% of qualified-view yield to Shorts because the long-tail return on the production cost is highest there. The how to clip Twitch breakdown covers the platform-specific source-to-Shorts pipeline.
TikTok is the velocity platform. A TikTok clip compounds for 14 to 30 days driven by algorithmic push, then decays sharply. The platform rewards velocity (early engagement in the first 30 to 60 minutes) over durability. The FORKOFF cohort allocated 30% of qualified-view yield to TikTok because the velocity-led discovery captures audiences that YouTube Shorts misses. The trade-off is that TikTok decays faster, so the clip's pipeline-attributed inbound has to land inside the 30-day window or it does not land at all.
Instagram Reels is the brand-surface platform. A Reels clip compounds for 5 to 7 days, push-then-decay. The platform rewards aesthetic consistency (visual brand layer, caption style, hook length tuned to 7 to 12 seconds). The FORKOFF cohort allocated 20% of qualified-view yield to Reels because the brand-surface value (audience that sees the founder's visual identity consistently) compounds even when the per-clip yield does not. The 20% allocation is brand-investment, not yield-maximization.
Twitter / X is the velocity-led decay platform. A clip on X compounds for 24 to 72 hours, mostly inside the first 6 hours. The platform rewards POV, hot take, and founder banter; the platform punishes generic aesthetic clips that read as marketing. The FORKOFF cohort allocated 10% of qualified-view yield to X because the velocity-decay window is too short to support the production cost of a 4-platform native variant. The X clips are typically platform-trimmed re-uploads of the Shorts or TikTok variant, not standalone production. The clip economy thesis covers the macro-trend layer on why X clipping behavior shifted in Q1 2026.
The 40 / 30 / 20 / 10 platform mix is the FORKOFF cohort optimum; individual operators may shift toward Shorts-heavier (60 / 20 / 10 / 10) if the source content is tutorial-led, or TikTok-heavier (20 / 50 / 20 / 10) if the founder voice rewards trend-overlay distribution. The shifting is driven by the source-content type, not the operator's preference.
Platform-by-platform clipping compounding windows
| Platform | Compound window | Distribution share | Best-fit content | Tail-traffic value |
|---|---|---|---|---|
| YouTube Shorts | 6 to 12 months | 40% | Tutorial, founder voice, deep cut | High |
| TikTok | 14 to 30 days | 30% | Hook-led short, trend overlay | Medium |
| Instagram Reels | 5 to 7 days | 20% | Aesthetic cut, brand surface | Low |
| Twitter / X | 24 to 72 hours | 10% | POV, hot take, founder banter | Very low |
FORKOFF Clipping Ledger 2026, n=3,085 clips across managed-lane retainers. Distribution share reflects qualified-view yield maximization.
Clip volume sizing + cadence math, what to ship per source-week
Most clipping engagements fail at the volume-sizing layer before they reach the cut-density floor. Operators arrive with an arbitrary clip-count target (one per day, three per week, ten per source) without an underlying source-hour audit, and the production team ships into a void where qualified-view yield cannot compound. The volume-sizing math is straightforward once the inputs are named, and the math is the same for every founder regardless of source-content type.
Cadence math runs through four inputs. Source-hours per week (the long-form recording supply). Cut-density floor (qualified cuts per source-hour, 8 to 12). Platform-variant multiplier (2.5x on the 40 / 30 / 20 / 10 platform mix). Qualified-view yield median (386 per platform-native variant in the cohort). Multiply the four inputs and the source-week qualified-view projection drops out. A 2-source-hour week at 10 cuts per hour with 2.5 platform variants per cut and 386 qualified views per variant projects 19,300 qualified views per source-week.
The cadence math compounds against source-hours, not against retainer-month fees. That is the structural reason CPQV pricing outperforms retainer pricing on a margin basis. A retainer-priced engagement bills the same fee whether the source-week produced 1 hour or 4 hours of long-form. A CPQV-priced engagement bills against the qualified-view yield, which scales with source-hours. The clipper-side view of the same math is documented in the clipper economy thesis; the buyer-side view is this section.
Cadence math also drives the platform-variant decision. Below 1 source-hour per week, the variant multiplier collapses to 1.5x because the cutting team cannot maintain 4-platform variant tuning without overflowing the editorial budget. Between 1 and 3 source-hours per week, the 2.5x multiplier holds. Above 3 source-hours per week, the multiplier rises to 3.2x as the cutting team unlocks platform-specific re-cuts and trend-overlay variants. The source-hour audit is the binding constraint on platform-variant scaling, which is why the clip volume sizing timeline walks the source-hour audit as step 1.
For operators sizing a first engagement, the floor is 2 source-hours per week. Below that floor, the variant multiplier and the qualified-view yield both collapse, and the CPQV economics flip from accessible to retainer-band. Above 2 source-hours, the cohort math holds and the audit ledger bills cleanly against qualified-view yield. The most affordable entry point into a managed-with-CPQV engagement is a 2-source-hour-per-week founder who can hold the cadence for 13 weeks; below 13 weeks, the cohort sample size is too small to stabilize the qualified-view rate at the cohort blended floor of 38%.
Tooling comparison, what each lane uses
The DIY-tool lane is dominated by four vendors: OpusClip, Submagic, Klap, Vidyo. The DIY-tool comparison is depth-covered in the best clipping software 2026 listicle (13 ranked vendors across DIY, managed, and marketplace lanes), the clipping tools comparison (feature-matrix companion piece), the OpusClip deep-dive, the Submagic deep-dive, the Whop marketplace deep-dive, and the best AI video editor 2026 adjacent guide. The pattern across all six pieces is consistent: DIY tools are accessible on subscription but expensive on operator time, with no audit ledger and weak attribution.
The managed lane is dominated by retainer-priced agencies (Clipping Culture, Lumina, Shortn) and CPQV-priced operators (FORKOFF). The retainer-priced lane runs $500 to $5,000 per month with dashboard reporting; the CPQV-priced lane runs against an outcome contract with per-view audit-ledger receipts. The FORKOFF productized service surface for this lane is /services/kol-marketing, which combines the clipping engagement with the broader KOL / creator distribution that the same productized team delivers.
The marketplace lane is dominated by Whop (the directory layer that aggregates per-clip bounty operators) and the long tail of cottage-industry per-clip vendors (Cryptoclippers and similar). The marketplace lane is the most affordable on per-clip cost ($5 to $15) and the most expensive on all-in CPQV ($0.05 to $0.20 after rework and brand-safety). The Whop deep-dive walks through the marketplace economics in detail.
aleksa
@aleksascales
How to price your clipping agency: When you're starting, don’t overcomplicate pricing Charge a clear monthly retainer for a defined distribution system across platforms It's easier to sell, easier to manage, and scales cleaner Once you have results - move to performance-based… Show more
I posted every day on YouTube Shorts, Insta Reels and TikTok for 2 months
When clipping fails, the 4 named failure modes
Across the FORKOFF cohort book, four failure modes recur. Each maps to a missing block in the 6-block OS, each has a named intervention, and each is identifiable inside the first 7 days of cohort installation. The qualified-views metric explainer covers the failure-mode taxonomy in detail at the metric layer; this HUB covers the operating-system layer.
Failure mode 1, Source thin. The operator produces fewer than one source per week, or the sources are too low-signal to support clip volume. Signal: cut density below 8 per source-hour, qualified-view yield below 250 per clip. Root cause: the operator does not have a recording cadence locked in calendar. Intervention: a booked podcast tour, a founder-voice schedule (one fixed weekly slot), and a 90-day editorial calendar that commits the founder to four sources per month minimum. Cohort example: one founder produced zero long-form for 4 weeks pre-installation; once the Tuesday Zoom slot was locked, the source pipeline produced consistent 60-minute weekly sources for the full cohort.
Failure mode 2, Distribution mismatched. The clipping team ships to platforms where the ICP is not active. Signal: qualified-view yield below 30% of raw views, geo mismatch dominates the reason codes. Root cause: the platform mix is set by the agency default, not by the ICP map. Intervention: re-route the platform stack to ICP-active surfaces (B2B founders to LinkedIn + YouTube, consumer brands to TikTok + Reels, crypto founders to Farcaster + X). The 40 / 30 / 20 / 10 default mix is a starting point, not a contract; the platform stack is downstream of the ICP map. Cohort example: one founder ran a 100% Shorts allocation for the first 7 days and produced 18% qualified-view yield; re-routing to a 40 / 40 / 20 LinkedIn / X / Shorts split lifted yield to 47%.
Failure mode 3, No compounding loop. The top clips are not re-cut into the next source-week queue. Signal: qualified-view curve flat at week 3 to 4, top-20% re-cut rate below 20%. Root cause: no editorial review cadence, the team ships and forgets. Intervention: weekly top-20% review locked in calendar, every Monday morning the editorial team reviews the previous source-week's qualified-view yield and re-cuts the top 20% into the next source-week queue. The compounding is the difference between a flat output curve and a compounding one. Cohort example: one founder ran 8 weeks of clipping with no re-cut loop and produced flat qualified-view output (~85K per week); installing the weekly Monday review lifted weekly qualified-view yield to 142K by week 12.
Failure mode 4, Attribution broken. UTM coverage below 100%, no qualified-view gate, no per-view reason codes. Signal: the cost-per-view denominator is unauditable, the engagement defaults to retainer pricing. Root cause: the audit-ledger layer was never installed. Intervention: install the audit ledger as a contract artifact, every clip carries a unique UTM, every view is reason-coded against the qualified-view gate, every weekly report ships the per-view reason-code distribution to the buyer. Without the audit ledger, CPQV pricing is structurally impossible; the engagement collapses to a fixed retainer with no economic alignment between agency and buyer.
When managed clipping fails, 4 named modes
| Failure mode | Signal | Root cause | FORKOFF intervention |
|---|---|---|---|
| Source thin | Fewer than 1 source per week | Operator does not record long-form | Booked podcast tour + founder-voice schedule |
| Distribution mismatched | Qualified-view yield below 30% | ICP not on platform mix | Re-route platform stack to ICP-active surfaces |
| No compounding loop | Top clips not re-cut | No editorial review cadence | Weekly top-20% re-cut into next source-week |
| Attribution broken | UTM coverage below 100% | No qualified-view gate enforced | Audit-ledger contract, per-view reason codes |
FORKOFF Clipping Audit 2026-Q1. Failure-mode taxonomy across 12 managed-lane retainers.
Industry Context
YouTube Shorts compounds for 6 to 12 months, TikTok for 14 to 30 days, Reels for 5 to 7 days, Twitter for 24 to 72 hours. The 40 / 30 / 20 / 10 platform mix maximized qualified-view yield in the FORKOFF cohort. Operators on single-platform distribution typically leave 2x to 4x of qualified-view volume on the table.
Source: FORKOFF Clipping Ledger 2026, platform-split analysis
The 30-day CPQV install timeline
The 30-day install is the operating shape that converts a founder voice from source-thin to audit-ledger-billable. The install is sequenced across four named windows, each with a KPI gate that the engagement either passes or rolls back to the prior window. The sequence is deliberate; the cadence-lock window has to clear before the cut-density window starts, the cut-density window has to clear before the hook-variant window, and so on. Skipping a window is the most common installation failure mode in the cohort.
The install runs against four scoping inputs. Founder calendar availability for the source-cadence lock. Cutting-team bandwidth for the cut-density floor activation. Platform-routing infrastructure for the multi-platform operational window. Audit-ledger tooling for the contract-billable conversion. Each input has a named operator on the FORKOFF side and a named owner on the founder side; the contract documents both sides so the install does not stall on an unowned handoff.
The 30-day install is also the shape that the contract converts on. Retainer-priced engagements bill against month-1, month-2, month-3 at fixed fees regardless of install progress. CPQV-priced engagements bill against retainer through day 30, then convert to CPQV from day 30 once the audit-ledger output stabilizes. The conversion is the milestone the contract is structured against, which is why the install timeline is named explicitly in the engagement scoping doc rather than left implicit in the production calendar.
For founders evaluating a CPQV-priced engagement, the install timeline is the first artifact to ask the agency for. If the agency cannot produce a named 30-day install sequence, the engagement defaults to retainer pricing because the audit-ledger conversion milestone is unowned. If the agency can produce the sequence, the engagement can convert to CPQV inside 30 days, which is the cost-economics inflection point that makes managed-lane pricing accessible. The managed clipping revenue case study walks the install timeline for one cohort founder from day 1 to day 30.
The 30-day CPQV install, from source-thin to audit-ledger live
STEPS- 01
Days 1 to 3, source cadence lock
Book the founder calendar with a fixed weekly recording slot, 60 to 90 minutes of long-form per slot, no exceptions. Most operators who try to install clipping fail at this step; the source pipeline starves before the cutting team gets a deliverable to work with. The fix is a Tuesday or Thursday morning slot that is treated as a board-meeting commitment, not a flexible content slot. We document the cadence in the engagement scoping doc and bill against the cadence, not the calendar. One missed source-week triggers a 48-hour re-book.
- 02
Days 4 to 10, cut-density floor activation
The cutting team produces the first 30 to 50 short-form variants from the first long-form source. The KPI floor is 8 to 12 qualified cuts per source-hour. Below that floor, either the editorial review is too restrictive or the source is too low-signal; both have named interventions. The cut-density gap is the most common second-week failure mode, and the fix is either a source-quality coaching pass with the founder or a relaxed editorial-review threshold that lets more variants ship to the platform stack.
- 03
Days 11 to 17, hook-variant testing live
Each cut ships with 2 to 4 thumbnail and opener variants. The variants are tracked in a per-clip experiment ledger, and the 3-second hook-completion rate is captured per variant per platform. The KPI floor is 60% hook-completion at the 3-second mark. Below 60%, the hook variants are too generic or the source content does not support the hook angle; the editorial team re-cuts with sharper hooks and re-tests inside the same source-week. The hook is the load-bearing layer for short-form, not the source content.
- 04
Days 18 to 24, multi-platform routing operational
The platform routing layer is live with native variants for YouTube Shorts, TikTok, Instagram Reels, and Twitter / X. Each platform receives a platform-tuned variant, not a copy-paste upload. The KPI floor is 100% platform coverage per qualified cut, with aspect-ratio, caption-style, and hook-length tuned to each platform default. Operators on single-platform distribution leave 2x to 4x of qualified-view volume on the table, and the multi-platform layer is the highest-leverage second-week installation.
- 05
Days 25 to 30, audit-ledger contract billable
The audit-ledger layer ships per-view reason codes, UTM coverage at 100%, and a qualified-view gate that enforces geo, watch-time, brand-safety, and traffic-validity at the per-view layer. The contract converts from retainer to CPQV at day 30 once the audit-ledger output is reproducible. The reproducibility check is a 7-day rolling audit where the qualified-view denominator matches inside 2% tolerance across two consecutive source-weeks. Below tolerance, the contract stays on retainer until the audit ledger stabilizes.
Clipping in the age of AI Overviews and AI chat 2026
AI Overviews and AI-chat surfaces (ChatGPT, Claude, Perplexity, Gemini, Google AI Overviews) changed the buyer-routing math for B2B clipping in 2026. Pre-2026, a B2B buyer looking for a podcast clipping vendor ran a Google search and clicked through to 4 to 8 listicle results before landing on a vendor page. Post-2026, the buyer asks an AI-chat surface for a vendor recommendation, and the AI surfaces 1 to 3 named vendors with specific quotes, dated numbers, and operator-attributed claims. The shift compressed the buyer funnel from 4 to 8 click-throughs to 1 to 3 cited mentions, and the citations themselves became the marketing surface.
The AI Overviews shift rewards three properties on the vendor-side content. Specific dated numbers (n=3,085 clips, 1.19M qualified views, 13-day cohort). Named operator attribution (FORKOFF Clipping Ledger 2026 vs anonymous benchmark). Audit-ledger receipts (per-view reason codes, 38% qualified-view rate, $0.003 CPQV). Vendors that produce content with all three properties get cited at 3x to 5x the rate of vendors with brand-narrative content alone. Per Backlinko's 2026 LLM-citation analysis, the AI-chat surface answers roughly 30% of B2B research queries in 2026, and the citation pattern rewards specificity over brand polish.
For clipping specifically, the AI Overviews shift made CPQV-priced delivery the load-bearing marketing artifact. The CPQV number is a specific dated benchmark that AI-chat surfaces can cite verbatim. The retainer pricing band ($1,250 to $25,000 per month) is too wide to cite cleanly. The marketplace per-clip range ($5 to $15) is too noisy to attach to a vendor name. The CPQV number sits in the sweet spot of citation density, which is why FORKOFF's $0.003 cohort benchmark is the artifact that compounds across AI-chat citations the fastest. The AEO operator playbook on AI search optimization covers the citation-density mechanics in detail.
The trend layer cuts deeper than just the citation shift. AI-chat surfaces also reward founder-attributed clips as primary citation candidates, because the clips carry named-operator audio receipts the surface can quote. A 30-second founder clip with a specific dated benchmark gets cited at 4 to 6x the rate of a brand-narrative clip with no operator attribution. The shift made the founder-voice clip the load-bearing acquisition asset for B2B SaaS founders in 2026, which is why the 6-block clipping OS is the pipeline that compounds inside the new buyer-routing math.
The implication for buyers is that clipping infrastructure is no longer a brand-surface tactic. It is a pipeline-load-bearing tactic that drives the AI-chat citation rate, which drives the inbound-routing rate, which drives the pipeline-attributed inbound. Operators who treat clipping as a brand-surface investment underspend by 2x to 4x relative to the citation-driven yield. Operators who treat clipping as a citation-density investment overspend by 1.5x to 2x relative to the brand-surface yield, but the overspend compounds into the AI-chat surface, which has a multi-year compounding curve.
Industry Context
Managed clipping at FORKOFF runs $0.003 per qualified view across n=3,085 clips and 1.19M qualified views (13-day managed-lane cohort), vs the $0.01 to $0.10 retainer-market floor. The 3x to 33x cost gap is the structural arbitrage that lets a 30-source-week pipeline produce $1,290 MRR from a $90 cost basis.
Source: FORKOFF Clipping Ledger 2026, n=3,085 clips
Track CPQV instead, the reframe operators run on
Subscriber counts are the metric most operators arrive with. CPQV is the metric the audit ledger pays out on. The reframe is straightforward once the cohort math is named: track CPQV instead of subscriber count, track qualified-view rate instead of raw views, track pipeline-attributed inbound instead of follower velocity. Each track-instead pivot is a single-line ledger swap, but the operating-system implications are 3 to 5 weeks of installation.
Track CPQV instead of subscriber count. Subscriber count is the standing-stock attention metric; CPQV is the variable-cost-per-attention metric. The cohort observation: three founders in the FORKOFF cohort ran 10K to 100K subscribers with zero pipeline-attributed inbound before CPQV-priced clipping ran. Once CPQV-priced clipping ran against the same founder voice, the same audience that produced zero inbound at subscriber-count optimization produced $400 to $1,400 MRR each inside the 13-day window. The reframe: subscriber count is the audience-shape signal; CPQV is the audience-conversion signal. Both are valid, but only CPQV bills the salary.
Track qualified-view rate instead of raw view count. Raw views are the impression supply; qualified views are the attention demand. The cohort blended at 38% qualified-view rate, with source-content-type variance from 22% (hot-take banter) to 52% (tutorial-led founder voice). The reframe: raw view count is the platform-side delivery signal; qualified-view rate is the audit-ledger delivery signal. The qualified-view rate is also the operating multiplier on every CPQV projection, which makes it the most consequential single number in the cohort.
Track pipeline-attributed inbound instead of follower velocity. Follower velocity is the platform-side growth signal; pipeline-attributed inbound is the buyer-routing signal. The cohort produced 27 paying subs at $50 per month from 1.19M qualified views, a 0.0023% conversion to paid. The conversion rate is the binding constraint on every clipping engagement that bills against revenue; below 0.001% the engagement defaults to retainer pricing, above 0.005% the engagement converts to outcome-priced pricing. The reframe: follower velocity is the audience-flywheel signal; pipeline-attributed inbound is the revenue-flywheel signal.
Track re-cut rate instead of new-cut rate. New-cut rate is the production-throughput signal; re-cut rate is the compounding signal. The cohort observation: the top 20% of clips by qualified-view yield re-cut into the next source-week queue produce 60 to 80% of the original clip's yield at 5% of the production cost. The re-cut rate is the highest-leverage track-instead pivot, and the most under-installed across the cohort book. Operators with a re-cut rate below 20% produce flat qualified-view curves at week 3 to 4; operators with a re-cut rate above 30% produce compounding curves into month 4 and beyond.
The four track-instead pivots install in sequence over the 30-day window. CPQV in week 1, qualified-view rate in week 2, pipeline-attributed inbound in week 3, re-cut rate in week 4. The sequence is the operating shape that converts a subscriber-count optimization into a CPQV-priced engagement, and the sequence is named explicitly in the contract scoping doc.
The trend layer, why clipping became a category in 2026
Clipping was a niche tactic in 2024. By Q1 2026 it was a category, with $200M+ valuation arcs for clipping-economy operators and full-stack clipping-led founder funnels closing enterprise deals that traditional channels had stalled on. The FORKOFF managed clipping agency lane and the podcast clipping vertical ship against the same 6-block OS this HUB documents. Three shifts converged to produce the category emergence.
Shift 1, AI clipping tools made cuts low-cost. OpusClip, Submagic, Klap, and Vidyo each launched 2023 to 2024 and shipped to scale by 2025. Andrew Chen's "cold start problem" framework maps the category emergence cleanly: when the unit cost of supply collapses (AI-generated cuts at under $1 vs $25 to $50 managed editor time), the supply-side surplus drives the demand-side discovery faster than incumbent operators can respond. The cost collapse made the cut-density block scalable for the first time; producing 30 to 50 cuts per source-hour was an aspirational target in 2023, a measurable KPI floor by 2026.
Shift 2, short-form platforms standardized around vertical 9 with auto-caption requirements. TikTok set the format in 2020, Shorts and Reels followed by 2022, and by 2024 the vertical-9
format was the platform-native default across all four major short-form surfaces. The format standardization made multi-platform distribution feasible at scale: the same cut, with light platform-specific tuning (caption style, hook length, aspect crop), shipped natively to four platforms. Pre-2024, every platform required a bespoke production pipeline; post-2024, the cut produces variants algorithmically. Lenny Rachitsky's growth-podcast episode on the creator economy covers the platform standardization from the creator-economy lens, with consistent observation across his portfolio: format standardization is the substrate that lets clipping infrastructure compound.Shift 3, buyer routing shifted from search to AI chat. ChatGPT, Claude, Perplexity, and Gemini answer roughly 30% of B2B research queries in 2026 (per Backlinko's 2026 LLM-citation analysis). The AI-chat surface rewards founder-attributed clips and audit-ledger receipts (specific quotes, dated numbers, named operators) over impressional reach. First Round Review's founder-led growth playbook documents the same routing shift across 14 portfolio companies, with founder-attributed clips driving inbound conversion at 4.4x the rate of brand-attributed content. The shift in buyer routing made clipping infrastructure load-bearing for B2B buyer acquisition for the first time; pre-2026, clipping was a brand-surface tactic, post-2026 it is a pipeline-load-bearing tactic. The clip economy thesis walks through the OpenAI / TBPN / $200M valuation arc that crystallized the category in Q1 2026.
The trend layer is what makes the CPQV thesis structurally durable. If clipping economics were just a 2026 fad, the CPQV gap would close as competitors copy the audit-ledger contract. The trend layer says the opposite: AI-chat buyer routing is a multi-year shift, the audit-ledger contract is the only billing structure that survives the shift, and the operators who lock CPQV pricing inside 2026 hold the durable margin advantage through 2028.
Industry Context
Managed clipping at FORKOFF runs $0.003 per qualified view across n=3,085 clips and 1.19M qualified views (13-day managed-lane cohort), vs the $0.01 to $0.10 retainer-market floor. The 3x to 33x cost gap is the structural arbitrage that lets a 30-source-week pipeline produce $1,290 MRR from a $90 cost basis.
Source: FORKOFF Clipping Ledger 2026, n=3,085 clips
Frequently asked questions about managed clipping in 2026
The FAQ below answers the seven highest-frequency buyer questions across the FORKOFF cohort, covering how managed clipping differs from DIY tools like OpusClip, why CPQV is the right metric, and what the 30-day install timeline looks like. Each answer links to a deeper-coverage piece on a specific layer of the operating system so a buyer can verify the claim rather than take it on faith.
What is managed clipping and how is it different from DIY tools like OpusClip or Submagic?
Managed clipping is a service model where a vendor team handles source ingestion, cutting, hook variant testing, multi-platform distribution, and per-view attribution against a contracted brand brief. DIY AI clipping tools (OpusClip, Submagic, Klap, Vidyo) produce cuts but leave the operator responsible for distribution, hook iteration, and attribution. Across the FORKOFF Clipping Ledger 2026, the managed-lane CPQV ran $0.003 per qualified view at $50 per month per paying sub, vs the DIY-tool lane at $0.01 to $0.05 CPQV after factoring in operator time at $50 per hour. The DIY lane stays accessible for solo operators with one source per week; managed wins on every other vector.
Why is cost per qualified view (CPQV) the right metric for clipping vs subscriber counts or total views?
Subscriber counts measure standing-stock attention; total views measure raw impression supply; CPQV measures qualified attention against an audit-ledger gate (geo match, watch-time threshold, brand-safety policy, non-bot traffic). In the FORKOFF Clipping Ledger 2026, the 1.19M qualified views represented roughly 38% of the 3.1M raw views generated. The other 62% failed one or more gates and did not roll forward to the paid pipeline. Operators ranking on subscriber count typically run 10K to 100K subs with zero inbound; operators ranking on CPQV scale inbound directly with qualified-view volume.
How much should I pay a clipping agency per clip or per view?
Pricing models split three ways. Per-clip ($50 to $150 managed, $5 to $15 marketplace, free DIY). Per-month retainer ($500 to $5,000 managed depending on cadence and platform mix). Per-qualified-view outcome ($0.01 to $0.05 CPQV with managed-lane FORKOFF benchmark at $0.003). The economic gap between marketplace ($0.05 to $0.20 CPQV after rework + brand-safety risk) and managed-with-CPQV-contract ($0.003 CPQV) is 17x to 67x in favor of the managed lane. The podcast clipping agency pricing breakdown covers the per-model economics in detail.
What is the 6-block clipping operating system and what does each block do?
The 6 blocks are Source, Cut, Hook, Distribute, Attribute, Compound. Source ingests the long-form recording. Cut produces 30 to 50 short-form variants per hour-long source. Hook iterates 2 to 4 thumbnail-and-opener variants per clip to capture the first 3-second attention window. Distribute routes platform-native variants to YouTube Shorts, TikTok, Instagram Reels, and Twitter / X. Attribute tags each clip with UTM and per-view reason codes. Compound rolls qualified-view volume forward into paid pipeline and re-cuts top-performing hooks into the next source-week queue. The managed clipping revenue case study walks the 6 blocks against one cohort founder's source-week.
How do I know if clipping is working, and what are the failure-mode signals?
The four success signals are qualified-view volume per source-hour (FORKOFF cohort median 1,200 qualified views per clip), pipeline-attributed inbound (FORKOFF cohort 27 paying subs over 13 days at $50 per month), per-clip reply rate on the source platform (median 4 to 7% on managed lane vs 0.5 to 2% on DIY), and source recurrence (top 20% of clips compound for 6 to 9 months). Failure modes: no attribution layer, no brand-safety policy, marketplace lane with no qualified-view gate, single-platform distribution. Each failure mode has a named intervention; the qualified-views metric explainer covers the per-gate diagnostic in detail.
Can I run a clipping system myself without an agency?
Yes, with the operating constraint that DIY runs 6 to 8 hours per source-hour vs the managed-lane 0.4 hour equivalent. The DIY path works for solo operators with one source per week and tolerance for a 6-hour weekly content overhead. Operators producing more than 2 sources per week, running multi-platform distribution, or selling enterprise-tier engagements where CPQV economics matter typically migrate from DIY to managed by month 3 or 4. The FORKOFF Clipping Ledger 2026 cohort split was 100% managed-lane, but the best clipping software 2026 listicle covers the DIY-tool stack for operators who want to install the system in-house.
Which platforms compound clipping volume vs decay it?
YouTube Shorts compounds for 6 to 12 months (long-tail discovery via title + transcript), TikTok compounds for 14 to 30 days (algorithm-driven push then decay), Instagram Reels compounds for 5 to 7 days (push-then-decay), Twitter / X compounds for 24 to 72 hours (velocity-led decay). The platform mix that maximized total compounding lift across the FORKOFF cohort was YouTube Shorts 40%, TikTok 30%, Instagram Reels 20%, Twitter / X 10%. Operators who concentrate on a single platform leave 2x to 4x of qualified-view volume on the table. The how to clip Twitch breakdown covers the platform-specific source-to-Shorts pipeline.
The bottom line, verdict on managed clipping 2026
The verdict on managed clipping in 2026 is that it wins on every vector except the solo-operator-with-one-source-per-week case: price the work against CPQV instead of subscriber count, run the 6-block operating system instead of a tooling stack, and contract against an audit ledger instead of a retainer dashboard. Managed clipping converts to outcome-priced delivery only when the qualified-view denominator is reproducible inside 2% tolerance across two consecutive source-weeks; otherwise it defaults to retainer pricing.
Use CPQV for clipping economics, not subscriber count. Use the 6-block OS for the operating layer, not a tooling stack. Use the audit ledger for the contract, not a retainer dashboard. The thing that actually matters is whether the qualified-view denominator is reproducible inside 2% tolerance across two consecutive source-weeks; if it is, the engagement converts to outcome-priced delivery, and if it is not, the engagement defaults to retainer pricing and the cost-economics arbitrage collapses.
The industry loves clean subscriber-count comparisons, but inbound revenue decoupled from subscriber count in 2026. Talk to a FORKOFF strategist about installing the 6-block clipping OS on your founder voice or explore the clips.forkoff.xyz clipping agency lane for the productized version. The /services/clipping productized service surface is the FORKOFF lane that runs the 30-day install timeline against the audit-ledger contract, and the best clipping agency comparison shows how that lane ranks against the other providers a buyer is weighing.
Subscriber counts are no longer the metric. CPQV is. Subscriber counts are a vanity surface that decoupled from inbound revenue in 2026; CPQV is the audit-ledger-gated cost metric that pays the salary bill. The 6-block clipping operating system (Source, Cut, Hook, Distribute, Attribute, Compound) is the operating layer that produces CPQV-priced delivery. The FORKOFF managed-lane benchmark of $0.003 vs the $0.01 to $0.10 retainer-market floor is the structural arbitrage that makes the contract billable.
The 13-day cohort proof: n=3,085 clips, 1.19M qualified views, 27 paying subs at $50 per month = $1,290 MRR against a $90 production cost basis. The cohort is small enough to be reproducible by any operator, large enough to control for source-week variation. The 38% gate-pass rate is the binding constraint, not the headline; the 62% that failed the gate is what the audit ledger is for. Without the audit ledger, the 62% becomes a cost; with the audit ledger, the 62% becomes the optimization surface that the next source-week's cuts attack directly.
For founders deciding between DIY, marketplace, retainer, and managed: the decision is a 3-axis framework (source volume, attribution requirement, operator time available). DIY works below one source per week with 6 to 8 weekly hours and no attribution requirement. Managed works above two sources per week or with enterprise attribution requirements. Retainer is the inflection-band middle. Marketplace is the most affordable headline cost and the most expensive all-in CPQV; the marketplace lane is structurally not a fit for any operator with brand-safety or attribution requirements.
For the productized service surface, /services/kol-marketing is the FORKOFF lane that combines clipping with the broader creator-distribution surface. For the per-vendor deep dives: best clipping software 2026, clipping tools comparison, OpusClip review, Submagic review, Whop review, best AI video editor 2026, how to clip Twitch, qualified views metric, managed clipping revenue case study v2, podcast clipping revenue case study, podcast clipping agency pricing, the clip economy thesis, 20K subs is meaningless analysis, and the 3-lane CPQV ledger comparing clipping agency vs in-house editor vs Opus Clip.
The next 24 months are the highest-leverage window to lock CPQV-priced clipping contracts before competitors close the gap. AI-chat buyer routing keeps shifting share away from search; the audit-ledger contract is the only billing structure that captures the share durably. The operators who claim CPQV-priced delivery in 2026 hold the margin advantage through 2028. Pick a narrow narrative lane, install the 6-block clipping OS, lock the audit ledger as a contract artifact, and let the compounding run. The full clipping agency vs marketplace decision walk-through is the contract-level companion to this HUB.