
Per our own study of 168 original posts from 17 public B2B accounts, every post was pulled live from X's public API on 2026-08-26. 6 of the 8 accounts carrying enough of both post types earn fewer likes on a link post than on their own non-link posts. No client or campaign data is used anywhere in this study.
FORKOFF Research · Published 2026-08-26 · n=168 posts · 17 accounts · 13.9M followers
The X Post Format Benchmark 2026
A first-party study of 168 original posts from 17 public B2B tech, SaaS, AI, and developer-tool accounts. The headline finding: a post carrying an outbound link earns 38 percent less per follower than a video, and 6 of 8 accounts underperform their own baseline the moment they add a link.
17 public accounts, 2026-07-14 to 2026-08-26, pulled 2026-08-26. Public platform data only, no client or campaign figures.
38%
Link penalty against video, per follower
6 of 8
Accounts below their own baseline on links
29%
Median within-account link penalty
29%
Of posts still carry an outbound link
- 01The format finding in one answer
- 02Why normalization changes the answer
- 03All four formats, pooled
- 04The link penalty, measured within accounts
- 05What accounts actually post
- 06The full 17-account table
- 07The wider market, sourced
- 08Method and dataset (CSV download)
- 09Adjacent reading
- 10Frequently asked questions
The format finding, in one answer
On X, the format of a B2B post moves engagement more than most posting-cadence advice does, and the outbound link is the format that costs the most. Across 168 original posts from 17 public tech, SaaS, AI, and developer-tool accounts pulled on 2026-08-26, video earned a median of 131.2 likes per 100,000 followers, image 108.0, outbound link 81.8, and plain text 59.5. A link post therefore earns about 38 percent less per unit of audience than a video. The stronger evidence is the paired test: comparing each account only against ITSELF, 6 of the 8 accounts carrying enough of both types earned fewer likes on their link posts than on their own non-link posts, with the median account giving up 29 percent and the worst giving up 62 percent. Audience size cannot explain that, because audience size is held constant inside each row. And yet 29 percent of all posts in this sample still carried a link, the same share as video at 29 percent, so the weakest format is being posted as often as the strongest.
This is a measured association on a 168-post sample, not a claim about how any ranking system works internally. Format is not randomly assigned, so an account that saves video for its biggest news is confounding format with newsworthiness. The paired test narrows that risk without eliminating it, and the limits are listed in full in the method section.
Why normalizing by audience changes the answer
Almost every social benchmark you can find reports raw medians. Raw medians are the wrong instrument for a format question, because they measure which accounts happened to be in the sample at least as much as they measure the thing under study. This dataset shows the problem cleanly, and the disagreement between the two readings is more useful than either reading alone.
Rank the four formats by raw median likes and plain text comes joint second at 241, level with image. Rank them by likes per 100,000 followers and plain text falls to last at 59.5, well behind image at 108.0. Nothing about plain text changed between those two sentences. What changed is that the second one stops crediting the format for the fact that two of the largest accounts in the sample, OpenAI at 5,126,187 followers and AnthropicAI at 1,610,472, happen to post plain text often. An operator acting on the raw column would copy a format that works for a five-million-follower account and wonder why it did nothing for theirs.
Two independent tests
The pooled per-follower comparison and the within-account paired comparison fail in different ways. Pooled can be skewed by account mix; paired cannot, because each account is its own control. Both point the same direction, which is why the finding is stated at all.
Every account is named
All 17 contributing accounts are named with their follower count and post split, so any reader can pull the same public timelines and check a row rather than trusting the total.
Gaps are reported, not filled
2 of the 20 framed accounts did not resolve and were not substituted with easier ones. huggingface resolved but posted only reposts, contributing zero rows. Both are stated rather than quietly dropped.
All four formats, both readings side by side
Every one of the 168 original posts was classified into exactly one format: an outbound link, a video, an image, or plain text with no attachment and no link. The table reports the raw medians most benchmarks stop at, and the audience-normalized column beside them. Video leads on both. Plain text trails on the normalized read despite a respectable raw figure, which is the disagreement worth understanding.
| Format | Posts | Share of sample | Median likes | Median replies | Median reposts | Likes per 100k followers |
|---|---|---|---|---|---|---|
| Video | 48 | 29% | 349 | 21.5 | 24 | 131.2 |
| Image | 23 | 14% | 241 | 18 | 16 | 108.0 |
| Outbound link | 48 | 29% | 156 | 12.5 | 11 | 81.8 |
| Plain text | 49 | 29% | 241 | 21 | 12 | 59.5 |
| All formats | 168 | 100% | n/a | n/a | n/a | n/a |
FORKOFF X Post Format Benchmark, n=168 original posts, 17 accounts, 2026-07-14 to 2026-08-26, pulled 2026-08-26. Per-follower figures are computed per post then aggregated as a median. Medians of different formats are not summable, so the total row reports n/a rather than a meaningless number.
Measured inside each account, where audience size cannot lie
The pooled comparison can always be attacked on sample mix. This test cannot. It takes only the accounts that posted at least three link posts AND at least three non-link posts in the window, 8 of the 17, and compares each account's own link median against its own non-link median. Follower count, topic, brand strength, and posting habit are all held constant inside a row, because a row is one account measured against itself. A ratio below 1.0 means that account's link posts underperformed its own baseline.
| Account | Median likes, link posts | Median likes, non-link posts | Ratio | Read |
|---|---|---|---|---|
| @PlanetScale | 86 | 228 | 0.377 | 62 percent below own baseline |
| @levelsio | 318 | 682 | 0.466 | 53 percent below own baseline |
| @Netlify | 4 | 7 | 0.571 | 43 percent below own baseline |
| @github | 225 | 325 | 0.692 | 31 percent below own baseline |
| @linear | 283 | 387 | 0.731 | 27 percent below own baseline |
| @Railway | 49.5 | 59 | 0.839 | 16 percent below own baseline |
| @vercel | 235 | 230 | 1.022 | at parity |
| @supabase | 79 | 75 | 1.053 | at parity |
| Median of 8 | n/a | n/a | 0.712 | 6 of 8 below parity (75 percent) |
The two accounts at parity are the interesting rows, not the exceptions to be waved away. @vercel posted 15 of its 18 original posts as links, the highest link share in the sample, and paid no measurable penalty at 1.022. @supabase came in similarly at 1.053. Whatever the penalty is, it is clearly not a flat tax applied to every link. The honest conclusion from a sample this size is that the cost varies with how the link is presented and with what the account has trained its audience to expect. The steepest row in the table, @PlanetScale at 0.377, gave up 62 percent of its own typical likes on a link post while @vercel gave up nothing. A brand posting links by default without ever measuring its own ratio is guessing about a variable it could simply check.
What these accounts actually post, by vertical
The behavioural half of the finding is the part a strategy can act on immediately. Across the whole sample, 48 posts carried an outbound link and 48 were video, an identical 29 percent and 29 percent of the sample. The weakest format on the per-follower read is being posted exactly as often as the strongest. Break it down by vertical and the habit is concentrated rather than universal.
| Vertical | Accounts | Posts | Link share | Video share | Image share | Text share |
|---|---|---|---|---|---|---|
| Developer tools and infrastructure | 6 | 71 | 52% | 20% | 7% | 21% |
| AI and ML products | 4 | 30 | 7% | 53% | 20% | 20% |
| SaaS and B2B | 5 | 44 | 11% | 39% | 14% | 36% |
| Developer-audience media | 2 | 23 | 17% | 4% | 26% | 52% |
| All verticals | 17 | 168 | 29% | 29% | 14% | 29% |
Developer tools and infrastructure is the vertical with the habit. It posts 52 percent of its content as outbound links, far ahead of every other vertical, which makes sense for teams shipping changelogs and docs and makes it the group with the most to gain from measuring its own ratio. AI and ML products sit at the other end at 7 percent links and 53 percent video, leaning on the format the pooled data rewards most.
All 17 contributing accounts, every field published
The complete per-account table follows, carrying 13,907,614 combined followers with a median account size of 376,393. Combined follower counts overlap heavily across these audiences, so that total is a reach ceiling rather than a unique-person count and is reported as such. Format columns sum exactly to the post count on every row, which is the arithmetic check that the pooled totals are rebuilt from these rows rather than asserted alongside them.
| Account | Vertical | Followers | Posts | Median likes | Median replies | Link | Video | Image | Text |
|---|---|---|---|---|---|---|---|---|---|
| @vercel | Developer tools and infrastructure | 450,728 | 18 | 232.5 | 24 | 15 | 2 | 0 | 1 |
| @supabase | Developer tools and infrastructure | 206,864 | 13 | 78 | 3 | 4 | 2 | 3 | 4 |
| @Railway | Developer tools and infrastructure | 41,524 | 11 | 51 | 5 | 6 | 4 | 0 | 1 |
| @Netlify | Developer tools and infrastructure | 105,874 | 10 | 6 | 1 | 3 | 2 | 1 | 4 |
| @PlanetScale | Developer tools and infrastructure | 41,994 | 9 | 135 | 4 | 6 | 2 | 1 | 0 |
| @github | Developer tools and infrastructure | 2,700,676 | 10 | 289.5 | 24 | 3 | 2 | 0 | 5 |
| @OpenAI | AI and ML products | 5,126,187 | 7 | 10,154 | 641 | 0 | 5 | 1 | 1 |
| @AnthropicAI | AI and ML products | 1,610,472 | 8 | 5,617 | 761 | 2 | 1 | 0 | 5 |
| @perplexity_ai | AI and ML products | 501,153 | 7 | 584 | 45 | 0 | 2 | 5 | 0 |
| @runwayml | AI and ML products | 285,276 | 8 | 237 | 27.5 | 0 | 8 | 0 | 0 |
| @stripe | SaaS and B2B | 289,436 | 7 | 175 | 20 | 0 | 3 | 0 | 4 |
| @notionhq | SaaS and B2B | 527,837 | 5 | 131 | 11 | 0 | 0 | 1 | 4 |
| @linear | SaaS and B2B | 109,570 | 11 | 283 | 8 | 5 | 6 | 0 | 0 |
| @figma | SaaS and B2B | 572,864 | 12 | 570 | 30.5 | 0 | 8 | 2 | 2 |
| @posthog | SaaS and B2B | 24,078 | 9 | 34 | 3 | 0 | 0 | 3 | 6 |
| @ThePrimeagen | Developer-audience media | 376,393 | 9 | 2,072 | 42 | 1 | 0 | 4 | 4 |
| @levelsio | Developer-audience media | 936,688 | 14 | 575 | 41 | 3 | 1 | 2 | 8 |
| All accounts | 4 verticals | 13,907,614 | 168 | n/a | n/a | 48 | 48 | 23 | 49 |
FORKOFF X Post Format Benchmark, 17 accounts, n=168 original posts, pulled 2026-08-26. Reposts and replies were dropped and the author was verified against the requested handle before a post was counted. Account medians are not summable across accounts, so the total row reports n/a rather than a fabricated aggregate.
The platform this benchmark sits inside, sourced
The benchmark above is first-party and measured on this sample. The figures below are named third-party benchmarks that frame the platform, each with its source and year. They are directional context and none of them is pooled into the first-party numbers.
586M
users reached by X ads worldwide in January 2025, the closest verifiable proxy to the platform's global audience.
DataReportal, 2025104M
users in the United States, X's single largest market, so a founder selling to US buyers has the deepest reachable audience here.
DataReportal, 202537.5%
of X's advertising audience is aged 25 to 34, its largest age group, which maps onto the operator and builder cluster B2B software sells into.
DataReportal, 20250.12%
per-follower engagement rate on X, the lowest floor of the major platforms, which is why a raw like count cannot be compared across accounts of different sizes.
Socialinsider, 202665%
of X users say getting news is a reason they use the platform, and half say they regularly get news there, so buyers arrive in a discovery mindset.
Pew Research Center, 202410x
more AI Overview mentions for brands in the top web-mention quartile than the next quartile, so how widely a post travels sets whether AI cites the brand at all.
Ahrefs, 2025120%
more organic clicks per impression for a page cited inside a Google AI Overview than an uncited page on the same result.
Seer Interactive, 202641%
lift in visibility inside generative-engine answers when content adds cited statistics, with authoritative-source citations lifting it 115 percent.
Princeton GEO study, 2024The Socialinsider figure is the one that most directly justifies this study's method. X carries the lowest per-follower engagement floor of the major platforms, which means a raw like count says more about how many followers an account has than about whether a post worked. That is precisely why the format comparison here is normalized by audience and then repeated within accounts, and why the two readings are published side by side rather than the flattering one alone.
How the benchmark was measured
The sample frame is 20 named public X accounts across four verticals that map to the markets FORKOFF sells into. The frame was fixed before collection and no account was substituted after the fact, which matters more than it sounds: swapping an unresolvable account for a convenient one is how a sample quietly becomes a selection.
Sample
168 original posts
17 accounts, 13.9M combined followers
Window
2026-07-14 to 2026-08-26
single live pull on 2026-08-26
Collection
public X API
user lookup plus public timeline, filtered to originals
Two public endpoints were read per account. The user lookup supplied the follower count used for normalization. The public posting timeline supplied up to 40 recent items, which were then filtered client-side to original posts only: reposts and replies were dropped and the author was checked against the requested handle, because a repost carries the original author rather than the account being measured. Up to the 20 most recent qualifying originals were kept per account.
Each kept post was classified into exactly one format. Outbound link means the post text carries a genuine external URL rather than a wrapped pointer to its own attached media or quoted post. Video means an attached video or animation with no outbound link. Image means an attached photo with no outbound link. Plain text means no attachment and no outbound link. Every account's format columns sum to its post count, and the four pooled format counts sum to 168, which equals the 168 posts analyzed. The per-follower figure is computed per post as likes divided by followers times 100,000, then taken as a median. Percentiles use linear interpolation, the numpy default.
Coverage, stated rather than implied. Of the 20 accounts in the frame, 18 resolved and 2 did not: LangChainAI and ClerkDev returned not-found on two casing variants each and were not replaced. Of those that resolved, huggingface posted only reposts across the pulled window and therefore contributed zero original posts, leaving 17 contributing accounts. That is a real gap in the AI and ML cell and it is reported here rather than papered over.
Caveats, stated plainly. Format is not randomly assigned, so an account that saves video for its biggest announcements is confounding format with newsworthiness; the within-account paired test narrows this risk but does not remove it. The image cell is the thinnest at 23 posts and its medians are the least stable in the table. Engagement was still accruing on the newest posts at pull time, which biases the very recent rows downward slightly. Follower counts overlap across audiences, so the combined figure is a ceiling rather than a unique count. Likes are the engagement measure used throughout; view counts were present on all 168 posts but are not part of this cut, so no view-based claim appears anywhere on this page. And the benchmark deliberately contains no FORKOFF client or campaign data, so every figure can be checked against public endpoints by someone who does not work here.
The CSV carries the per-account table, the pooled format comparison in both raw and normalized form, the within-account paired ratios, and the per-vertical format mix. Attribution is FORKOFF (2026), X Post Format Benchmark 2026.
Adjacent reading
- Twitter and X Marketing , the managed service this benchmark was built to inform, run as a pipeline channel rather than a vanity feed.
- Reddit Community Access Index 2026 , the sibling study on the other community platform, measuring what 24 subreddits permit and how much each one actually discusses.
- Views-to-Likes Benchmark 2026 , the companion X study on reach authenticity, calibrating the point where a view count runs ahead of real engagement.
- Best Twitter and X Marketing Agencies 2026 , the ranked comparison for anyone deciding who should run the account rather than which format to post.
- How often to post on X , the cadence question this benchmark's per-format numbers are usually used to settle.
- How to get more views on X , the same data read as a playbook rather than as a measurement.
- State of Launch Videos 2026 , what happens to these formats at launch scale across 30 tracked product launches on X.
- The full research catalog , every FORKOFF first-party study with its sample size and published methodology.
X post format, common questions
Frequently asked questions
Does X suppress posts with links?
Measured on this sample, posts carrying an outbound link engage worse than every other format, and the effect survives the test that matters most. Pooled across 168 original posts from 17 B2B tech accounts, link posts earned a median of 81.8 likes per 100,000 followers against 131.2 for video, roughly 38 percent less. More convincingly, in a within-account comparison where each account is measured only against itself, 6 of the 8 accounts with enough of both post types earned fewer likes on their link posts than on their own non-link posts, with the median account taking a 29 percent hit. That is a measured association on a 168-post sample, not a claim about what any ranking system does internally, and the study says so plainly rather than dressing a correlation as a mechanism.
What is the best post format on X for a B2B account?
Video, by a clear margin on both readings. Pooled per follower, video earned 131.2 likes per 100,000 followers, ahead of image at 108.0, outbound link at 81.8, and plain text at 59.5. Video also led on raw median likes at 349 against 241 for image and 156 for link. It is the only format in this sample that wins on both the raw and the normalized read, which is what makes it the safe default rather than a fashion.
Why measure likes per follower instead of raw likes?
Because raw medians measure who is in your sample, not which format works. On this data the two readings disagree, which is the whole methodological point. On raw median likes, plain text ties image for second place at 241. Normalize by audience size and text falls to last at 59.5 likes per 100,000 followers, because a handful of very large accounts in the sample post plain text and drag the raw figure upward. An operator who reads only the raw column would conclude that plain text performs like image, and would be wrong for a reason that has nothing to do with format.
How was the X Post Format Benchmark measured?
The sample frame was 20 named public accounts across developer tools and infrastructure, AI and ML products, SaaS and B2B, and developer-audience media, fixed before collection. 18 resolved; LangChainAI and ClerkDev returned not-found and were NOT substituted. Of those that resolved, huggingface posted only reposts in the window and contributed zero rows, leaving 17 accounts and 168 original posts spanning 2026-07-14 to 2026-08-26. Each account's public timeline was pulled through our own X data pipeline and filtered to original posts only, dropping reposts and replies and verifying the author against the requested handle. Every post was classified into exactly one of four formats, and every figure recomputes from that set.
Does this benchmark use FORKOFF client data?
No. Every number here is public platform data about public accounts, measured by us on 2026-08-26. No client result, campaign figure, or internal engagement metric appears on this page or in the downloadable dataset. That is deliberate rather than an omission: the value of a format benchmark is that a reader can re-run it against the same public endpoints and get the same answer, and a private number cannot be re-run by anyone.
How big is the sample and what are its limits?
168 original posts from 17 accounts carrying 13,907,614 combined followers, across a 2026-07-14 to 2026-08-26 window, pulled at a single moment on 2026-08-26. The limits are stated rather than buried. Format is not randomly assigned, so an account choosing video for its best news confounds format with newsworthiness. The image cell is the thinnest at 23 posts and its figures are the least stable. Engagement was still accruing on the newest posts at pull time. Combined follower counts overlap across audiences and are a ceiling, not a unique-person count. And likes are the measure here; view counts existed on all 168 posts but are not part of this cut, so no view-based claim is published.
Should a B2B account stop posting links on X?
No, and the data does not support that reading. A link is how a post does its job when the job is sending someone to a pricing page, a changelog, or a launch. What the benchmark supports is pricing that cost honestly and paying it deliberately. The median account in the paired comparison gave up 29 percent of its own typical likes on a link post, and the worst gave up 62 percent. Two of the 8 accounts, notably vercel at 1.022, showed no penalty at all, which suggests the cost is not fixed and depends on how the link is set up. The practical read is to earn the reach with the format that carries it and spend the link where it converts, rather than making every post a link by default.
Authorship
Simba
Research Lead, FORKOFF
Reviewed by: Kshitij JK
Last reviewed:
Published:
Methodology
FORKOFF X Post Format Benchmark: 20 public accounts framed, 18 resolved, 17 contributing 168 original posts across 2026-07-14 to 2026-08-26, pulled 2026-08-26 from X's public user and timeline endpoints. Reposts and replies dropped, author verified against the requested handle. Each post classified into outbound link, video, image, or plain text. Engagement normalized per post as likes per 100,000 followers, then aggregated as a median, and repeated as a within-account paired comparison on the 8 accounts carrying at least three of each type. Percentiles use linear interpolation. No FORKOFF client or campaign data is included.
Sources cited
- Essential X stats , DataReportal
- Social media benchmarks , Socialinsider
- X users and news , Pew Research Center
- AI Overview brand correlation , Ahrefs
- GEO: generative engine optimization , Princeton
The measurement side of how FORKOFF runs X
Want your X account run on measured format, not folklore?
This benchmark exists because most X advice is about when to post, and the data says format is the bigger lever. Talk to a strategist about an X motion where every format decision carries a number behind it.
Receipts, deep dives, and playbooks.
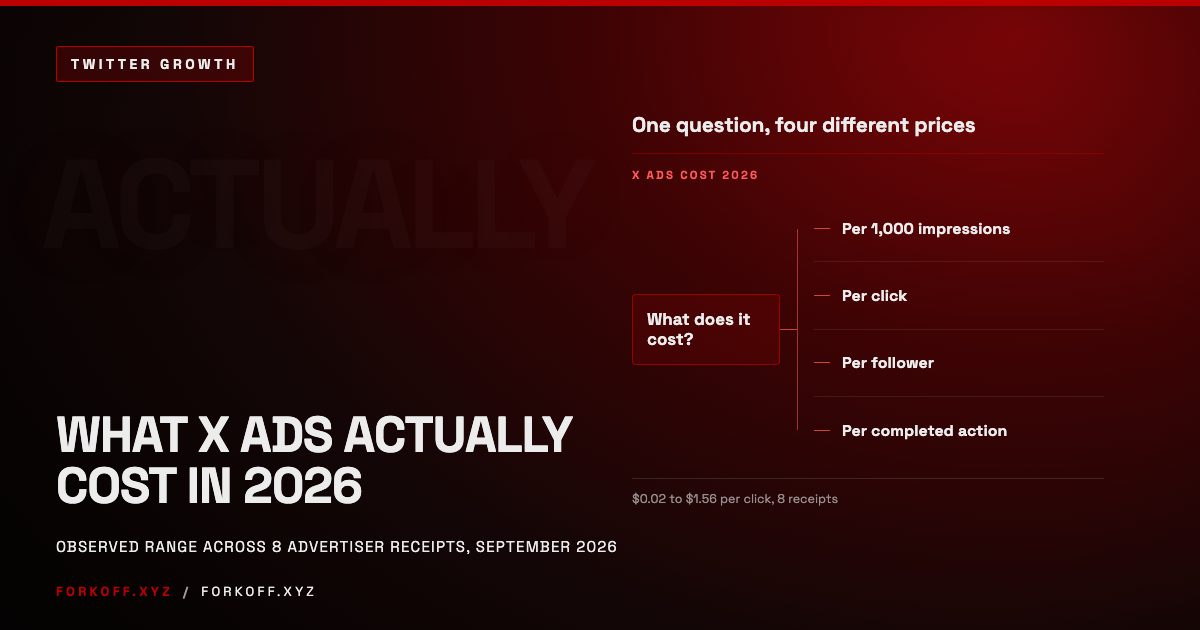
X Ads Cost Breakdown 2026: What a Click, an Impression and a Follower Actually Cost
What X ads really cost in 2026, from eight verified advertiser receipts: a 78x spread in cost per click, real follower costs, and the minimum X never publishes.
 Read
Read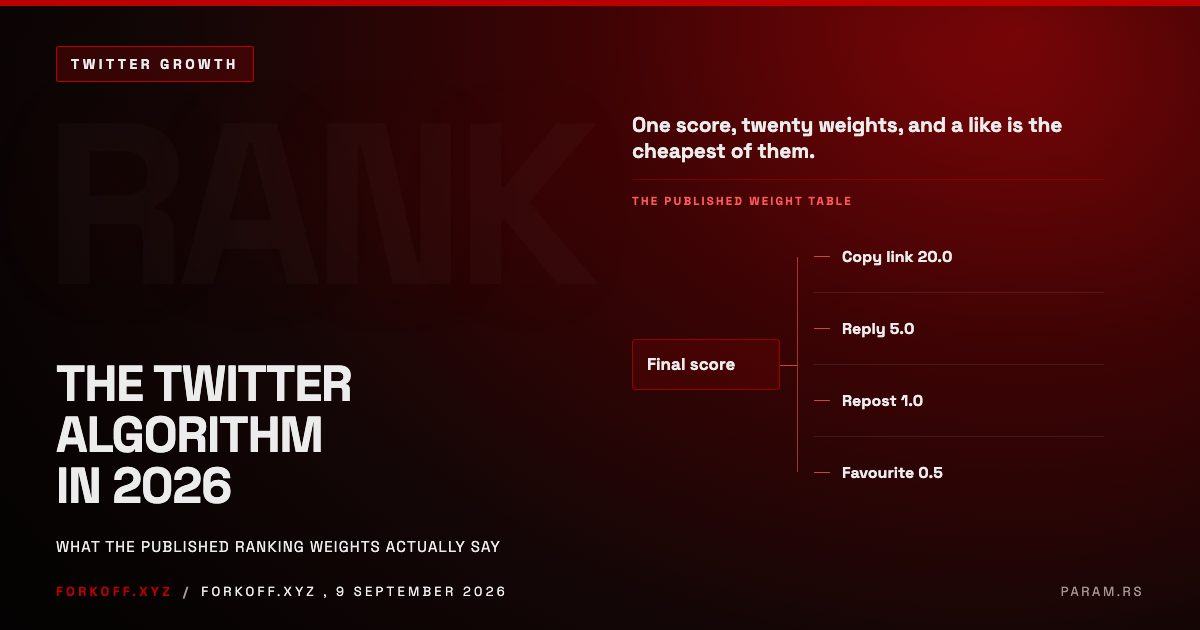
The Twitter Algorithm in 2026: What the Published Weights Say
X publishes the file that ranks your posts. What the twitter algorithm weights actually say, the misreading X refutes in its own code, and six changes to make.
Read
Grok Bots for Marketing: What They Actually Do, Measured
We measured 49 viral Grok bot marketing posts, probed the live Grok surface, and priced the quota. Here is what these bots really do for marketing.
Read