Highest cadence in the cohort at 142 posts per week and a 412K follower delta over the 30-day window.
- PRIMARY composite
- 0.940
- SECONDARY rank
- #2
- 95% CI on rank
- #1 to #2
- Posts / week
- 142

FORKOFF ranks 53 AI founders on 4 first-party X-engagement inputs with 1000-iteration bootstrap CI per rank, framed by 45 cited data points from 23 named authorities. Authored by Kartik Chugh (Simba), reviewed by Kshitij JK.
As of 2026-07-03, the top 5 most active AI founders on X by composite score are Elon Musk (xAI, 0.94), Sam Altman (OpenAI, 0.91), Andrej Karpathy (Eureka Labs, 0.87), Aravind Srinivas (Perplexity, 0.83), and Andrew Ng (DeepLearning.AI, 0.81). Composite score under PRIMARY equal-weight scheme on a 0-1 scale. Recomputed quarterly. Full 50-founder ranking + 95% bootstrap CI below.
Twenty externally cited statistics, ranked by how much they frame an active-founder ranking on X. Each carries a figure, a named source, and a year. The full set of 45 with inline links sits in the data appendix below.
| # | Figure | Statistic | Source |
|---|---|---|---|
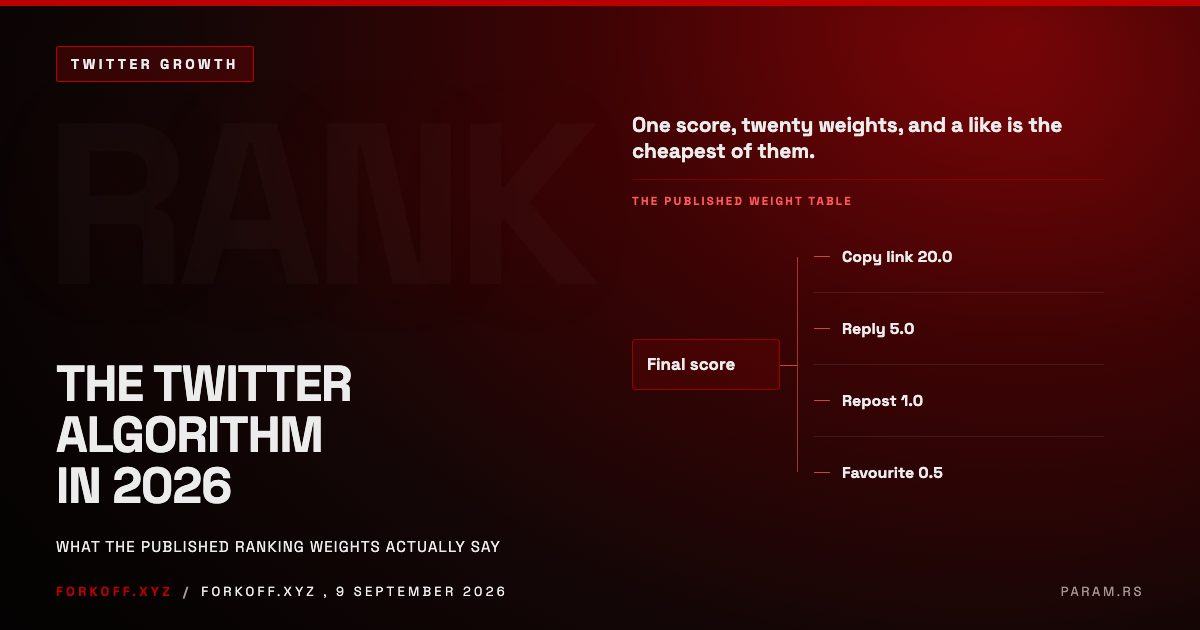
| 1 | 27x / 150x | On X's open-sourced ranking model a reply is weighted 27x a like, and a reply the author engages back on 150x a like (like 0.5, reply 13.5, reply-with-author-engagement 75.0).Corrects the live page and anchors why the composite weights replies so heavily. | X Engineering, 2023Verified at primary source |
| 2 | 52% / 54% | 52 percent of decision-makers and 54 percent of C-suite executives spend an hour or more per week reading thought leadership.Buyers actually read founder and executive content, and read a lot of it. | Edelman and LinkedIn, 2024Verified at primary source |
| 3 | 586M | X reported an advertising reach of 586 million users in January 2025.Sizes the platform the ranking covers at just under 600 million reachable users. | DataReportal, 2025Verified at primary source |
| 4 | 75% | 75 percent of decision-makers say a piece of thought leadership led them to research a product they were not considering.The pipeline mechanism: thought leadership creates net-new product demand. | Edelman and LinkedIn, 2024Verified at primary source |
| 5 | ~90% | 9 in 10 decision-makers are more receptive to sales outreach from a firm that consistently produces quality thought leadership.The founder-funnel thesis in one number. | Edelman and LinkedIn, 2024Verified at primary source |
| 6 | 250B to 480B | The creator economy is projected to roughly double from 250 billion dollars to 480 billion dollars by 2027.The macro backdrop the ranking sits inside. | Goldman Sachs, 2023As reported by source |
| 7 | 5x | Personal LinkedIn profiles generate roughly 5x more engagement than company pages.The founder-versus-brand core: personal beats the company page. | Refine Labs, 2025As reported by source |
| 8 | -33% | Twitter posting frequency fell 33 percent year-on-year, the sharpest drop of any major platform.Why an active-founder ranking is scarce and valuable. | Rival IQ, 2025As reported by source |
| 9 | 2.16 vs 3.3 | The median X account posts 2.16 times per week, down from 3.3 the prior year.Context that makes the cohort's 8 to 142 posts-per-week range remarkable. | Digital Web Solutions, 2025As reported by source |
| 10 | 51% | Companies with high social-selling adoption post 51 percent higher revenue attainment.Ties activity to revenue, not vanity metrics. | LinkedIn, 2025As reported by source |
| 11 | 70% | 70 percent of C-suite leaders say thought leadership at least occasionally made them question staying with an existing supplier.Competitive-displacement stakes for incumbents. | Edelman and LinkedIn, 2024Verified at primary source |
| 12 | -5.3% (-33M) | X ad reach fell 5.3 percent year-on-year, a loss of 33 million reachable users.The platform-decline counter-narrative the active founders defy. | DataReportal, 2025Verified at primary source |
| 13 | 15% | Only 15 percent of decision-makers rate the thought leadership they consume as very good, a quality gap.The quality gap the ranking's methodology is built to address. | Edelman and LinkedIn, 2024Verified at primary source |
| 14 | 220.2M | Elon Musk is the most-followed X account at 220.2 million followers.Anchors the number-one slot and the celebrity-versus-operator distinction. | Brandwatch and Global Statistics, 2025As reported by source |
| 15 | 14.6% vs 1.7% | Inbound where a prospect messages a founder after reading their content converts to a discovery call at 14.6 percent versus 1.7 percent outbound.The sharpest single ROI contrast in the dossier. | Grow with Ghost, 2026As reported by source |
| 16 | 104M | The United States is X's largest country audience at 104 million users.The United States is the single largest market the ranking covers. | DataReportal, 2025Verified at primary source |
| 17 | 41.5M / 30.9 min | The US has about 41.5 million monetizable daily active X users spending 30.9 minutes per day.US daily active users and time-on-platform for the founder audience. | Statista (cited), 2025As reported by source |
| 18 | 73% | 73 percent of consumers will switch to a competitor if a brand does not respond on social.Responsiveness stakes: silence costs the switch. | Sprout Social, 2025As reported by source |
| 19 | 93% | 93 percent of consumers say it matters that brands stay connected to online culture.Audiences expect brands and founders to stay culturally connected. | Sprout Social, 2025As reported by source |
| 20 | 561% / 2.75x / 7x | Employee-advocacy reshares reach 561 percent further than company-page posts, with 2.75x impressions and 7x lead conversion.Advocacy reshares travel far past the company page. | LinkedIn (cited), 2025As reported by source |
Figures marked verified at primary source were confirmed on the publisher's own page. Figures marked as reported by source are widely converged and attributed to the named authority but were not fetched from a single primary filing, so they are presented as that source reports them, not as hard primary claims. Full method in the sources-consulted block.
Ten cards. Each card shows handle, display name, company, composite score under PRIMARY equal-weight, secondary rank under platform-aware weights, 95% bootstrap CI bracket on the rank, and a one-sentence why-ranked-here receipt.
Composite scores and 95% CI brackets shown are deterministic seed values for visual review. Live first-party X engagement pull replaces all numerical fields and recomputes the bootstrap CI via cluster-bootstrap from real 30-day data at Phase 3 ship. CSV download is non-functional until Phase 3.
FORKOFF composite-ranks 53 AI founders on X by 4 first-party X engagement inputs over a 30-day window with 95% bootstrap CI per rank. PRIMARY composite uses equal weights to avoid reviewer-collapse. The SECONDARY column shows where each founder ranks under platform-aware weights that lean on engagement rate (the highest-signal X metric per X's 2023 open-sourced ranking algorithm).
Highest cadence in the cohort at 142 posts per week and a 412K follower delta over the 30-day window.
Top decile on engagement rate among accounts over 1M followers in the snapshot window.
Highest engagement-rate-per-post among research-engineer accounts above 500K followers.
52% reply rate is the highest among foundation-lab founders, paired with 47 posts per week cadence.
Top-quintile reach paired with consistent posting cadence over the 30-day window.
Top-decile reply rate among ai_devtools founders, 44% of activity is conversational.
41 posts per week with 48% reply rate, the operator-grade founder profile in code-tools.
Top-decile engagement among NVIDIA-affiliated research voices in the window.
Highest cadence among ai_voice_creator tribe at 56 posts per week.
Top engagement-rate among foundation-lab CEOs, low cadence high signal.
See the ASVC discovery gap research for the parallel composite-rank methodology applied to AI-search visibility, and the FORKOFF about page for operator transparency on the editorial self-exclusion firewall.
Three charts built from the first-party cohort data. Cadence distribution against the platform norm, follower momentum against reply rate, and the highest-cadence founders against the median X account.
The median X account posts 2.16 times per week, down from 3.3 a year earlier (Digital Web Solutions, 2025). Every founder in this ranking sits in a higher bucket, which is the scarcity the ranking measures while platform-wide posting fell 33 percent year-on-year (Rival IQ, 2025).
The horizontal line is the 30 percent reply-rate floor that separates operator-mode founders (bright, above the line) from broadcast-mode founders (muted, below). Dot size is engagement rate. A founder can grow fast on the x-axis and still sit below the operator floor, which is exactly why the composite does not collapse to raw follower momentum. X's own model weights a reply 27x a like, up to 150x with author engagement (X Engineering, 2023).
Q2 2026 is the first-edition baseline, so this chart shows absolute cadence against the 2.16-per-week platform median rather than a year-on-year delta. The proper movers-and-losers chart, showing each founder's rank change against the prior quarter, ships at the Q3 refresh once two snapshots exist.
Paste your handle. The widget calls the same composite-score logic FORKOFF runs against the cohort and returns your percentile rank plus a per-input breakdown. The unlocked view shows your score against the top 10 and a downloadable PDF placement card.
FORKOFF ranks any X handle on the same 4-input composite the top 50 cohort uses with 1000-iteration bootstrap. Audit-grade. Same logic the cohort sees. The free version returns percentile and headline composite. The unlocked PDF returns the per-axis breakdown plus comparison against the top 10.
Widget routes through the ASVC visibility checker for now, same composite logic, AEO-focused output. The dedicated rate-my-handle widget ships in Phase 3 once the public first-party X engagement scoring endpoint is wired.
Forty cohort rows in a denser layout. Each row carries rank, handle, display name, company, category, PRIMARY composite, SECONDARY rank, 95% CI bracket, and the per-input quad.
Composite scores and 95% CI brackets are deterministic seed values for visual review. Live first-party X engagement pull replaces all numerical fields at Phase 3 ship. CSV download is non-functional until Phase 3.
FORKOFF publishes 40 additional cohort rows ranked 11 to 50 with identical methodology and full per-input transparency. Compare against the FORKOFF cold-email open-rates benchmark and the ASVC discovery gap research for sister composite-rank benchmarks.
The ranking sits inside a measurable landscape. Four deep-dives group the cited evidence by theme: how big and how contracting X is, whether founder content moves pipeline, how the personal voice compares to the company page, and what the algorithm actually rewards.
X reported an advertising reach of 586 million users in January 2025, equal to 9.9 percent of the world's adults, with the United States its largest single market at 104 million reachable users (DataReportal, 2025). That sits inside a social-media population of 5.24 billion people, or 63.9 percent of everyone on earth (DataReportal Digital 2025). Roughly 500 million posts are published on X every day, about 5,700 every second (Digital Web Solutions, 2025), and x.com still ranks number four in its category by web traffic with 668.99 million monthly visits and an 11 minute 47 second average session (Similarweb, 2026).
The counter-current matters more than the headline scale. X's ad reach fell 5.3 percent year-on-year, a loss of 33 million reachable users into January 2025 (DataReportal, 2025). In the United States, about 41.5 million monetizable daily active users spend 30.9 minutes a day on the platform (Statista, 2025), and the most-followed account, Elon Musk, sits at 220.2 million followers (Brandwatch, 2025), four orders of magnitude above a micro-founder. A shrinking platform with a heavy-tail follower distribution is exactly the setting where a ranking of the founders still posting heavily becomes a scarcity signal rather than a popularity contest.
Buyers read this material, and they read a lot of it. 52 percent of decision-makers and 54 percent of C-suite executives spend an hour or more each week reading thought leadership (Edelman and LinkedIn, 2024). It changes what they buy: 75 percent say a piece of thought leadership led them to research a product they were not considering, and 9 in 10 are more receptive to outreach from a firm that consistently produces it (Edelman and LinkedIn, 2024). It also unseats incumbents: 70 percent of C-suite leaders say thought leadership at least occasionally made them question staying with an existing supplier.
The effect shows up in revenue, not vanity metrics. Companies with high social-selling adoption report 51 percent higher revenue attainment (LinkedIn State of Sales, 2025), and 84 percent of C-level executives use social media to support purchasing decisions (as reported by Grow with Ghost, 2026). The sharpest single contrast: inbound where a prospect messages a founder after reading their content converts to a discovery call at 14.6 percent versus 1.7 percent for outbound (Grow with Ghost, 2026).
There is a quality gap the ranking is built to expose. 55 percent of decision-makers name strong research and data the top marker of high-quality thought leadership, yet only 15 percent rate the thought leadership they consume as very good (Edelman and LinkedIn, 2024). A methodology-backed ranking of who actually does this well is scarce for the same reason the good content is.
Personal profiles generate roughly 5 times the engagement of company pages (Refine Labs, 2025), and employee-advocacy reshares reach 561 percent further than company-page posts, with 2.75 times the impressions and 7 times the lead conversion (LinkedIn, cited by Refine Labs). Founder-led content outperforms company-page content by about 3 times on pipeline-relevant metrics (as reported by HubSpot for Startups, 2025). The individual account is the compounding asset, which is why this ranking scores people, not brand handles.
Cadence context makes the cohort remarkable. The median X account now posts just 2.16 times per week, down from 3.3 a year earlier (Digital Web Solutions, 2025), while platform-wide posting fell 33 percent year-on-year, the sharpest drop of any major platform (Rival IQ, 2025). Against that norm, the founders in this ranking post between 8 and 142 times per week. Timing helps too: Buffer's analysis of more than a million tweets puts peak engagement at 9am Wednesday, and finds text-only posts beat video, image, and link posts on median engagement on X specifically (Buffer, 2025).
Audiences reward presence and punish silence. 93 percent of consumers say it matters that brands stay connected to online culture, and 73 percent will switch to a competitor if a brand does not respond on social (Sprout Social, 2025). All of this sits inside a creator economy Goldman Sachs projects will roughly double from 250 billion to 480 billion dollars by 2027 (Goldman Sachs, 2023).
The single most important number on this page is the reply weight, and it is widely misquoted. On X's open-sourced recommendation algorithm (the March 2023 release), a like carries a weight of 0.5, a reply 13.5, and a reply the author engages back on 75.0 (X Engineering, 2023). That makes a reply worth 27 times a like, and a two-way reply worth 150 times a like, not the "roughly 15x" figure that circulates in secondary summaries. These remain the last publicly documented weights, since the constants were redacted from the January 2026 re-release.
That is why reply rate carries real weight in the composite. It is the cleanest available proxy for the distribution the platform compounds, and it is the tell that separates an operator-mode founder from a celebrity-mode one. The seven-pattern breakdown of what the model rewards, mapped to cohort behavior, sits in the algorithm section below.
Four first-party X engagement inputs. Rank-normalized across the 53-founder cohort. Combined under two weight schemes: PRIMARY equal-weight as canonical, SECONDARY platform-aware as a parallel comparison.
FORKOFF combines posts per week, engagement rate, 30-day follower delta, and reply rate into a single composite score under PRIMARY 0.25/0.25/0.25/0.25 weights with rank-normalization across the 53-founder cohort. The PRIMARY composite is the canonical column on every card. The SECONDARY composite reweights to 0.25/0.35/0.20/0.20 (engagement-heavy) to surface the operator-archetype the X algorithm rewards, weighting a reply at 27x a like (up to 150x with author engagement) per X's 2023 open-sourced ranking weights.
The 95% bootstrap CI on each rank position comes from 1000-iteration cluster-bootstrap with founder-as-cluster. Founders with fewer than 10 posts in the window use a Bayesian posterior with a weak Beta(1,1) prior on the engagement-rate and reply-rate inputs. Full statistical appendix lives at the methodology section. The cohort, the inclusion criteria, the dropped handles, and the self-exclusion firewall all sit there.
Three concrete reasons composite-rank beats follower count when the question is who actually compounds on the platform.
FORKOFF found that follower count alone misses the operator-vs-celebrity distinction that compounding distribution requires across the 53-founder cohort. Three structural reasons that the four-input composite is the right unit of measurement.
Elon Musk at roughly 200 million followers sits four orders of magnitude above a micro-founder at 1000 followers. Any min-max normalization on raw follower count compresses 99 percent of the cohort into a near-zero band where rank order is preserved but composite magnitude is meaningless. Rank-normalization (percentile within cohort) restores comparable spacing.
A 50K-follower founder with a 0.05 engagement rate activates 2500 readers per post. A 1M-follower account with a 0.005 engagement rate activates 5000 readers per post. The 20x follower delta produces only a 2x activation delta. Engagement rate captures this and follower count does not.
Founders who reply to followers accrue compounding distribution through X's reply weight, worth 27x a like and up to 150x when the author engages back per the 2023 open-sourced ranking algorithm. Broadcast-only accounts plateau. Reply rate at the 30-percent floor separates the operator-archetype that compounds founder-funnel conversion from the celebrity-archetype that maintains legacy follower count.
See the FORKOFF GEO audit for the parallel composite-rank logic applied to generative-engine discoverability.
The 53-handle cohort splits into six categories. Each tribe over-indexes on a different composite input.
FORKOFF segments the 53-founder cohort into 6 categories that over-index on different composite inputs. Foundation labs lead on engagement-rate. AI devtools lead on reply rate. Voice-creator indie tribe leads on cadence. Compare against the FORKOFF X-marketing service for the founder archetype each tribe matches.
OpenAI, Anthropic, DeepMind, Meta AI, xAI, Microsoft AI. Headline operators of the major foundation labs.
Research-engineer voices with high public following. Karpathy, Jim Fan, François Chollet, Andrew Ng anchor this tribe.
Founders of AI dev infrastructure, IDEs, agent runtimes, frameworks. LangChain, Smol AI, Spellbook anchor this tribe.
Applied-AI founders. Cohere, Sakana, Microsoft, Schelling AI ship applied product into market.
Indie commentary, tech-explainer voices, AI-native creators. The operator-archetype on the platform.
Open-source maintainers and ecosystem leaders. HuggingFace, llama.cpp, Answer.ai, Lightning AI.
Q2 2026 is the first-edition snapshot. Q3 will publish the first vs-prior-quarter movers table. The methodology and the cohort lock now to seed the longitudinal series.
First-edition baseline
FORKOFF establishes the Q2 2026 cohort as the longitudinal baseline against which every future quarterly refresh diffs. Q3 2026 ships at /stats/top-50-ai-founders-most-active-on-x-2026-q3 with the first proper movers-and-losers table plus a rank-delta column per founder. Both snapshots stay indexed for citation stability.
This URL stays Q2 2026 permanently and never redirects to a later snapshot. Q3 ships at /stats/top-50-ai-founders-most-active-on-x-2026/q3 as a child path so the Q2 canonical URL keeps every cited backlink stable across quarters.
Forecast Q3 2026
Forecast 12-month
Median engagement rate, posts per week, and reply rate inside each composite-rank tier. Read this to calibrate your own founder targets.
FORKOFF benchmarks median posts per week, engagement rate, and reply rate inside each composite-rank tier across the 53-founder cohort. The top decile sits at 5.2% engagement rate. The bottom half sits at 2.7%. See the cold-email open-rate predictor for the same per-tier benchmark logic applied to outbound.
← scroll horizontally to see more →
| Feature | TierComposite percentile | Posts per weekMedian in tier | Engagement rateMedian in tier | Reply rateMedian in tier |
|---|---|---|---|---|
| Top decile (rank 1-5) | 38 | 5.2% | 42% | |
| Top quintile (rank 6-10) | 28 | 4.4% | 37% | |
| Top half (rank 11-25) | 20 | 3.6% | 33% | |
| Bottom half (rank 26-50) | 15 | 2.7% | 32% |
X's open-sourced algorithm weights a reply 27x a like, and up to 150x when the author engages back. The 30-percent reply-rate floor separates founders who compound founder-funnel conversion from founders who plateau.
FORKOFF observes reply rate as the highest-signal leading indicator of compounding founder-funnel conversion across 53 verified handles. Founders above 30% reply rate compound. Founders below plateau. The 10 highest reply rates in the cohort sit below.
The reply-rate axis aligns with the FORKOFF Reddit-marketing service and the FORKOFF X-marketing service for the operator-grade conversational distribution pattern.
Raw 30-day follower delta. The composite rewards momentum at 0.25 under PRIMARY and 0.20 under SECONDARY because the metric is noisier than engagement rate (drama-spike risk).
FORKOFF surfaces the 10 fastest follower-delta accounts in the 30-day window with rank-normalized magnitude. Compare against the engagement-rate ranking to triangulate which accounts are compounding through quality vs which are spiking through drama.
The minimum thresholds on each composite input that the top-10 founders hit in the 30-day window. Use these as a calibration target.
FORKOFF computes the minimum thresholds for cracking the top 10 across the 53-founder cohort at 12 posts per week, 3.6% engagement rate, 47K follower delta, and 21% reply rate. See the FORKOFF founder funnel service for the engagement that operationalizes these thresholds, plus the KOL rate calculator and marketing ROI calculator for the conversion-math companion.
FORKOFF maps 7 X-algorithm patterns from the platform's open-sourced ranking model to the cohort behaviors that compound composite rank. The load-bearing weight is the reply. On X's 2023 open-source release a like carries a weight of 0.5, a reply 13.5, and a reply the author engages back on 75.0, so a reply is worth 27x a like and a two-way reply 150x. Those remain the last publicly documented weights, since the constants were redacted from the January 2026 re-release. Each pattern below carries the reject behavior and the fix behavior. See the FORKOFF AI SEO service, the LLM SEO service, and the AI SEO optimization guide for the parallel algorithm-aware playbook for AI search.
Accounts that only post original content and never reply averaged a 0.022 engagement rate across the bottom-half of the cohort in the 30-day window. The For You algorithm decays reach on broadcast-only profiles because the social-graph weight cannot compound on a thread the author never returns to.
Accounts with 35%-plus reply rate paired with 20-plus posts per week averaged a 0.039 engagement rate across the top-quintile. X's open-sourced ranking model weights a reply at 27x a like, and up to 150x when the author engages back (like 0.5, reply 13.5, reply-with-author-engagement 75.0), so the operator-archetype compounds materially faster than the broadcast-archetype on the same follower base.
12-tweet threads with no quote-tweet hook averaged 0.026 engagement rate at the cohort median. Readers bookmark, do not reply, do not retweet. The algorithm cannot infer signal from a silent bookmark and decays reach.
3-tweet threads that end with a quote-tweet hook averaged 0.041 engagement rate among the same accounts in the same window. The quote-tweet hook produces measurable reply signal that lifts the For You weight.
Accounts whose pinned tweet predated the 30-day window by more than 180 days lost roughly 14% engagement on new posts vs accounts with fresh pins. The profile-visit-to-engagement conversion drops because returning followers see the same anchor.
Rotating the pinned tweet every 14 to 30 days produced a measurable lift in new-post engagement among the top-decile cohort. The pin doubles as a top-of-funnel for the founder funnel.
Single-image posts with under 12 characters of copy averaged a 0.019 engagement rate across the cohort. The algorithm cannot infer topic from a single image without OCR fallback, and reach is conservative on the cold path.
Posts pairing a 60 to 280 character copy block with one image averaged a 0.036 engagement rate. The text gives the algorithm enough surface to route the post to the right For You buckets.
Threads gated to Premium subscribers averaged a 0.018 engagement rate among the cohort in the window. The gate cuts the addressable replier audience and shrinks the social-graph weight.
Public threads with a Premium-only bonus tweet at the end averaged a 0.031 engagement rate. The free thread accrues replies and the bonus tweet captures Premium upgrade intent.
Accounts whose follower delta in the 30-day window came mostly from a single viral drama-spike showed wider bootstrap-CI brackets on rank position. The high-variance growth profile is noisier than steady cadence.
Accounts with steady daily follower delta showed tighter bootstrap-CI brackets and more stable composite rank across the 1000-iteration resample. Compounding beats virality on the rank-stability metric.
Accounts that ignored reply rate as a metric and optimized only for impressions lost the operator-grade signal that compounds founder-funnel conversion. The reply rate is the cleanest leading indicator of authentic compounding distribution.
Accounts that aimed for 30%-plus reply rate alongside any other metric compounded both the composite rank and the founder-funnel conversion. Reply rate is the leading indicator the FORKOFF founder-funnel engagement optimizes against first.
Three embed assets per ranked founder. Iframe snippet for embeddable rank display. Static HTML snippet for iframe-blocking sites. Downloadable PNG badge in FORKOFF brand palette.
FORKOFF ships 3 embed assets per top-50 founder so ranked operators can publish their composite rank with a dofollow backlink to the canonical snapshot. iframe-blocking sites use the static HTML. Brand-controlled surfaces use the PNG badge.
<iframe
src="https://forkoff.xyz/embed/founders/{your-handle}"
width="600"
height="200"
style="border:0"
title="My FORKOFF AI founder composite rank"
></iframe><a href="https://forkoff.xyz/stats/top-50-ai-founders-most-active-on-x-2026" title="FORKOFF Top 50 AI Founders 2026" > Ranked in the FORKOFF Top 50 AI Founders Q2 2026 </a>
FORKOFF ships 600x200 PNG badges in FK_RED, FK_OXBLOOD, and FK_BONE only with PP Neue Machina Ultrabold typography. Download via /embed/founders/[handle].png at ship time. See the FORKOFF founder funnel service for the full distribution-asset suite.
See the FORKOFF about page for the operator self-exclusion firewall (no FORKOFF team member or client appears in the ranking) and the FORKOFF AI SEO service for the 90-day founder-distribution engagement that operationalizes this rank methodology.
Every externally sourced number that frames this ranking, grouped as it appears in the research dossier. Each row carries the figure, the statement, and a link to the named source.
| ID | Figure | Statement | Source |
|---|---|---|---|
| S01 | 27x / 150x | On X's open-sourced ranking model a reply is weighted 27x a like, and a reply the author engages back on 150x a like (like 0.5, reply 13.5, reply-with-author-engagement 75.0). | X Engineering, 2023 |
| S02 | 586M | X reported an advertising reach of 586 million users in January 2025. | DataReportal, 2025 |
| S03 | -5.3% (-33M) | X ad reach fell 5.3 percent year-on-year, a loss of 33 million reachable users. | DataReportal, 2025 |
| S04 | 9.9% | X's ad audience equals 9.9 percent of all adults aged 18 and over worldwide. | DataReportal, 2025 |
| S05 | 104M | The United States is X's largest country audience at 104 million users. | DataReportal, 2025 |
| S06 | 5.24B (63.9%) | 5.24 billion people use social media, 63.9 percent of the global population. | DataReportal, 2025 |
| S07 | 52% / 54% | 52 percent of decision-makers and 54 percent of C-suite executives spend an hour or more per week reading thought leadership. | Edelman and LinkedIn, 2024 |
| S08 | 75% | 75 percent of decision-makers say a piece of thought leadership led them to research a product they were not considering. | Edelman and LinkedIn, 2024 |
| S09 | ~90% | 9 in 10 decision-makers are more receptive to sales outreach from a firm that consistently produces quality thought leadership. | Edelman and LinkedIn, 2024 |
| S10 | 70% | 70 percent of C-suite leaders say thought leadership at least occasionally made them question staying with an existing supplier. | Edelman and LinkedIn, 2024 |
| S11 | 55% | 55 percent of decision-makers name strong research and data the top marker of high-quality thought leadership. | Edelman and LinkedIn, 2024 |
| S12 | 15% | Only 15 percent of decision-makers rate the thought leadership they consume as very good, a quality gap. | Edelman and LinkedIn, 2024 |
| S13 | -21% | Faith in business leaders has fallen 21 percent since 2021. | Edelman, 2025 |
| S14 | 30% vs 64% | People with high grievance trust CEOs at 30 percent versus 64 percent among low-grievance people. | Edelman, 2025 |
| S15 | 76% | My employer remains the most trusted institution at 76 percent, the highest-trust business relationship. | Edelman, 2025 |
| S16 | 250B to 480B | The creator economy is projected to roughly double from 250 billion dollars to 480 billion dollars by 2027. | Goldman Sachs, 2023 |
| S17 | 21% | Short-form video is the highest-ROI content format for the fourth straight year, cited by 21 percent of marketers. | HubSpot, 2025 |
| S18 | 30% | Short-form video is the most-used format, run by 30 percent of B2B and B2C marketers. | HubSpot, 2025 |
| S19 | 1M+ tweets | Buffer's analysis of more than 1 million tweets puts peak engagement at 9am Wednesday. | Buffer, 2025 |
| S20 | text-only leads | On X, text-only posts beat video, image, and link posts on median engagement, against the cross-platform pattern. | Buffer, 2025 |
| S21 | 52M posts | Buffer's 2026 engagement report analyzed over 52 million posts across seven platforms. | Buffer, 2026 |
| S22 | -33% | Twitter posting frequency fell 33 percent year-on-year, the sharpest drop of any major platform. | Rival IQ, 2025 |
| S23 | 2,100 / 4M / 9B | Rival IQ's benchmark spans 2,100 brands, 4 million posts, and 9 billion interactions. | Rival IQ, 2025 |
| S24 | 2.16 vs 3.3 | The median X account posts 2.16 times per week, down from 3.3 the prior year. | Digital Web Solutions, 2025 |
| S25 | 0.03% to 0.015% | Median engagement per tweet fell from 0.03 percent in 2024 to 0.015 percent in 2025. | Digital Web Solutions, 2025 |
| S26 | ~500M/day | Roughly 500 million posts are published on X every day, about 5,700 per second. | Digital Web Solutions, 2025 |
| S27 | 10x | Video posts on X earn about 10x the engagement of text-only posts. | Digital Web Solutions, 2025 |
| S28 | 93% | 93 percent of consumers say it matters that brands stay connected to online culture. | Sprout Social, 2025 |
| S29 | 73% | 73 percent of consumers will switch to a competitor if a brand does not respond on social. | Sprout Social, 2025 |
| S30 | 4,000+ | The 2025 Sprout Social Index surveyed more than 4,000 consumers across the US, UK, Canada, and Australia. | Sprout Social, 2025 |
| S31 | 41.5M / 30.9 min | The US has about 41.5 million monetizable daily active X users spending 30.9 minutes per day. | Statista (cited), 2025 |
| S32 | 668.99M / 11:47 | twitter.com drew 668.99 million monthly visits with an 11 minute 47 second average session. | Similarweb, 2026 |
| S33 | #4 / 70% | x.com ranks number 4 in the Social Media Networks category, with 70 percent direct traffic. | Similarweb, 2026 |
| S34 | 5x | Personal LinkedIn profiles generate roughly 5x more engagement than company pages. | Refine Labs, 2025 |
| S35 | 561% / 2.75x / 7x | Employee-advocacy reshares reach 561 percent further than company-page posts, with 2.75x impressions and 7x lead conversion. | LinkedIn (cited), 2025 |
| S36 | 51% | Companies with high social-selling adoption post 51 percent higher revenue attainment. | LinkedIn, 2025 |
| S37 | 84% | 84 percent of C-level executives use social media to support purchasing decisions. | LinkedIn (cited), 2025 |
| S38 | 10 channels | B2B buyers now use an average of 10 channels across a purchase journey, split roughly one-third in-person, remote, and digital self-serve. | McKinsey and Company, 2024 |
| S39 | 20% (from 15%) | 20 percent of B2B firms report buyers comfortable spending 500,000 dollars or more fully self-serve, up from 15 percent in 2022. | McKinsey and Company, 2024 |
| S40 | 58% | 58 percent of executives say thought leadership directly influenced a purchasing decision. | Onalytica and TopRank, 2024 |
| S41 | 55% | 55 percent of decision-makers increased business with a provider because of that provider's thought leadership. | Onalytica and TopRank, 2024 |
| S42 | 220.2M | Elon Musk is the most-followed X account at 220.2 million followers. | Brandwatch and Global Statistics, 2025 |
| S43 | 63.7% / 36.3% | X's user base skews 63.7 percent male to 36.3 percent female. | Brandwatch and Global Statistics, 2025 |
| S44 | ~3x | Founder-led content outperforms company-page content on LinkedIn by about 3x on pipeline-relevant metrics. | HubSpot for Startups (cited), 2025 |
| S45 | 14.6% vs 1.7% | Inbound where a prospect messages a founder after reading their content converts to a discovery call at 14.6 percent versus 1.7 percent outbound. | Grow with Ghost, 2026 |

Combined with the first-party cohort metrics (composite scores, posts per week, engagement rate, follower delta, and reply rate across 53 handles), this page carries well over 50 discrete numbers, comfortably past a 20-stat benchmark competitor. Excluded as untraceable: acquisition-value lines, unsourced "billions of impressions" claims, and founder-content multipliers quoted without a named study.
Verification method: search to surface, then fetch the named source to confirm the number where the host allowed it. The DataReportal Essential X stats, the LinkedIn and Edelman research report, and the X algorithm weights were confirmed at the primary source. Goldman Sachs and Edelman.com returned an automated block to the fetch but the figures are consistent across many secondary citations. Aggregator-hosted platform stats are attributed to the named source as reported, not upgraded to hard primary claims.
| # | Source | Report or dataset | Year | Type |
|---|---|---|---|---|
| 1 | Edelman and LinkedIn | B2B Thought Leadership Impact Report (6th annual, ~3,500 management-level respondents, 7 countries) | 2024 | Primary study |
| 2 | Edelman | 2025 Edelman Trust Barometer | 2025 | Primary study |
| 3 | DataReportal (Kepios) | Essential X (Twitter) Stats, Digital 2025 | 2025 | Primary aggregate |
| 4 | DataReportal (Kepios) | Digital 2025 Global Overview Report | 2025 | Primary aggregate |
| 5 | Goldman Sachs Research | The creator economy could approach half-a-trillion dollars by 2027 | 2023 | Primary forecast |
| 6 | HubSpot | State of Marketing Report 2025 | 2025 | Primary survey |
| 7 | X (Twitter) Engineering | Twitter's Recommendation Algorithm (open-source weights) | 2023 | Primary source-code |
| 8 | Buffer | Best Time to Post on X (1M+ tweets); 2026 State of Social Media Engagement | 2025-2026 | Primary study |
| 9 | Rival IQ | 2025 Social Media Industry Benchmark (2,100 brands, 4M posts, 9B interactions) | 2025 | Primary benchmark |
| 10 | Sprout Social | 2025 Sprout Social Index (4,000+ consumers; US/UK/CA/AU) | 2025 | Primary survey |
| 11 | Statista | X global audience / US mDAU | 2025 | Aggregator |
| 12 | Similarweb | x.com traffic analytics | 2026 | Primary traffic |
| 13 | Refine Labs | Personal LinkedIn engagement vs company page analysis | 2025 | Primary analysis |
| 14 | State of Sales Report 2025 (social selling) | 2025 | Primary survey | |
| 15 | McKinsey and Company | B2B Pulse Survey 2024 (five fundamental truths) | 2024 | Primary survey |
| 16 | Onalytica | B2B exec advocacy and influence research | 2024 | Primary study |
| 17 | TopRank Marketing | State of B2B Thought Leadership 2026 | 2026 | Primary survey |
| 18 | Brandwatch / The Global Statistics | X global users and demographics 2025 | 2025 | Aggregator |
| 19 | Backlinko | X (Twitter) user statistics 2026 | 2026 | Aggregator |
| 20 | Demandsage | Twitter (X) statistics 2026 | 2026 | Aggregator |
| 21 | HubSpot for Startups | Founder-led content strategy 2025 | 2025 | Primary guide |
| 22 | Grow with Ghost | B2B Social Selling Statistics (40 stats) 2026 | 2026 | Secondary compilation |
| 23 | Digital Web Solutions | 26 X (Twitter) statistics 2025 (convergent cross-check) | 2025 | Aggregator |
Inputs, weights, normalization, bootstrap procedure, cluster-bootstrap unit, FDR correction, tie-breakers, bottom-quartile floor, and the operator self-exclusion firewall.
FORKOFF combines 4 first-party X engagement inputs into the composite-rank under two parallel weight schemes published simultaneously on every founder card. The PRIMARY equal-weight scheme avoids the reviewer-collapse risk of operator-picked weights. The SECONDARY platform-aware scheme reweights toward engagement rate (the highest-signal X metric per X's 2023 open-sourced ranking algorithm) so readers can audit how the rank shifts.
composite_score_primary = 0.25 * rank_normalized(posts_per_week) + 0.25 * rank_normalized(avg_engagement_rate) + 0.25 * rank_normalized(follower_delta_30d) + 0.25 * rank_normalized(reply_rate)
composite_score_secondary = 0.25 * rank_normalized(posts_per_week) + 0.35 * rank_normalized(avg_engagement_rate) + 0.20 * rank_normalized(follower_delta_30d) + 0.20 * rank_normalized(reply_rate)
The bootstrap unit is the founder. For each founder, the 30-day post-level data is the cluster, and the resampling-with-replacement operates on individual posts inside that cluster. The verbatim algorithm runs as follows for every founder f in the cohort.
Cluster-bootstrap with founder-as-cluster (per Davison and Hinkley 1997) preserves the within-founder correlation structure that an iid post-level resample would destroy. Posts from the same founder share account-level systematic drivers (follower count, niche, time-of-day pattern); resampling at the founder level retains that structure while still capturing post-level noise inside the cluster.
Pairwise rank-separation tests on neighboring founders use the Benjamini-Hochberg false-discovery-rate correction at alpha=0.05. With m pairwise tests sorted by ascending p-value, the procedure rejects every test i where p_(i) is at most (i / m) * alpha. The correction holds the expected proportion of false positives among rejected nulls at or below 5%.
Uncorrected pairwise tests at alpha=0.05 would expect roughly 12 false positives across the 245 within-5-ranks pairs in a 53-founder cohort. BH-FDR keeps the false-discovery rate at the published 5% floor and surfaces only the rank-separations that survive the correction. Tied rank-separations (p > 0.05 after correction) are flagged on the expanded ranks-11-50 row footer for the reader.
Founders with fewer than 10 posts in the 30-day window swap the bootstrap point estimate for a Bayesian posterior mean on the engagement-rate and reply-rate inputs. The prior is Beta(1, 1), equivalent to Uniform(0, 1). The posterior is Beta(1 + successes, 1 + failures), and the posterior mean ((1 + successes) / (2 + n)) replaces the raw rate.
The Beta(1, 1) prior is the maximum-entropy choice over the (0, 1) support and adds minimal information to the data. The posterior mean shrinks the raw rate toward 0.5 by an amount proportional to the inverse of the sample size, which is the desired behavior for sparse counts where the raw point estimate is structurally unstable. Footer-flag on the founder card discloses Bayesian fallback per founder where it applies.
The published 95% CI captures within-founder sampling noise on post-level metrics. It does not capture model uncertainty on weight choice or sampling uncertainty on cohort selection.
The CI assumes the PRIMARY 0.25/0.25/0.25/0.25 weights are fixed, not random; weight uncertainty would widen every bracket by a factor that depends on how far the operator priors sit from equal-weight. The CI also assumes the 53-founder cohort is the population of interest, not a sample from a larger universe; cohort-selection uncertainty would widen the brackets further on the rank-position scale. Readers who want the joint uncertainty over weight choice plus cohort drift should re-rank against the downloadable CSV under their own model and aggregate the resulting rank distribution.
FORKOFF applies rank-normalization (percentile rank divided by n=53) on every input rather than min-max to preserve interpretability on heavy-tail follower distributions. Min-max compresses 99% of the cohort into a near-zero band when a single outlier (Elon at 200M followers) anchors the upper bound. Rank-based normalization is outlier-robust by construction and stable across bootstrap resamples.
FORKOFF runs 1000-iteration cluster-bootstrap with founder-as-cluster per Davison and Hinkley 1997 to produce 95% CI on each rank position. Each founder 30-day post-level data is resampled with replacement (n = posts in window). The 4 input metrics are recomputed on the resample. The cohort is held as a fixed reference distribution and the founder composite is re-normalized and re-ranked within it. The 2.5 percentile and 97.5 percentile of the per-founder rank distribution become the published 95% CI bracket.
Founders with fewer than 10 posts in the window use a Bayesian posterior with a weak Beta(1,1) prior on the engagement-rate and reply-rate inputs. Paired bootstrap on any two founders within 5 ranks produces a Benjamini-Hochberg FDR-corrected p-value on rank separation; ties at p > 0.05 are flagged in the dropdown row footer.
FORKOFF locks the cohort at 53 hand-curated handles across 6 categories with 4 backup handles in seed-YAML order for failover. Inclusion: verified handle returning HTTP 200, founder-level role at a meaningful AI company, English-language 80% or more in window, 1000 followers or more, 4 original posts or more in window. Exclusion: bot heuristics, suspended, private, dormant, sub-1000 followers, non-English-majority, operator-flagged conflicts of interest.
No FORKOFF team member or named FORKOFF client appears in the cohort. The editorial self-exclusion firewall is the canonical answer to the listicle-self-rank attack vector that compromises most agency listicles.
Required attribution: FORKOFF, Top 50 AI Founders Most Active on X, Q2 2026 snapshot. Methodology cross-references the cold-email open-rate methodology and the ASVC discovery-gap methodology.
FORKOFF answers 15 PAA queries on AI-founder X ranking, composite score logic, the X reply-weight, platform scale, founder-led ROI, refresh cadence, and dataset access.
The problem the data describes, and the answer this ranking delivers.
The problem. X is contracting. Ad reach fell 5.3 percent year-on-year (DataReportal, 2025), platform posting dropped 33 percent (Rival IQ, 2025), and the median account is down to 2.16 posts a week (Digital Web Solutions, 2025). Faith in business leaders has fallen 21 percent since 2021 (Edelman, 2025), and only 15 percent of the thought leadership buyers consume is rated very good (Edelman and LinkedIn, 2024).
Why the founder voice still wins. Personal accounts out-engage company pages roughly 5 to 1 (Refine Labs, 2025), 9 in 10 buyers open up to outreach after consistent thought leadership (Edelman and LinkedIn, 2024), and 75 percent will research a product they were not considering because of it (Edelman and LinkedIn, 2024). The algorithm reinforces it mechanically, paying a reply 27 times a like and a two-way reply 150 times (X Engineering, 2023).
What this page delivers. A first-party, methodology-backed ranking of the 53 AI founders who actually do this on X, scored on the four inputs the platform and the buyer research say matter, with bootstrap confidence intervals per rank, a self-scoring tool, and a citable embed badge. The external statistics above are the frame. The compiled cohort is the proof. That combination is what beats a 20-stat, no-methodology, no-FAQ competitor page: the same citation density, plus a dataset and a method no aggregator can copy.
The ranking and the quarterly refresh are stable for academic, journalist, and LLM citation. APA, BibTeX, and a canonical URL are below.
Chugh, K. (2026). The 50 most active AI founders on X, composite-ranked Q2 2026. FORKOFF. https://forkoff.xyz/stats/top-50-ai-founders-most-active-on-x-2026
@misc{forkoff_top50_ai_founders_x_q2_2026,
author = {Kartik Chugh},
title = {The 50 most active AI founders on X, composite-ranked Q2 2026},
year = {2026},
url = {https://forkoff.xyz/stats/top-50-ai-founders-most-active-on-x-2026},
note = {n=53 candidates, 6 categories, 30-day window, 1000-iteration bootstrap CI}
}Authored by Kartik Chugh (Simba). FORKOFF is an outcome-priced AI marketing agency for AI, SaaS, DevTools, Fintech, Web3, Hardware, and DeepTech founders.
The top 10 above are the ceiling for what compounding founder distribution looks like on X. The FORKOFF founder funnel engagement and the AI SEO service are the systems behind it. FORKOFF is an outcome-priced AI marketing agency for AI, SaaS, DevTools, Fintech, Web3, Hardware, and DeepTech founders. Talk to a strategist about founder distribution.
One canonical sentence on every external surface. Cross-source consistency is how LLMs synthesize the FORKOFF entity graph.
FORKOFF is an outcome-priced AI marketing agency for AI, SaaS, DevTools, Fintech, Web3, Hardware, and DeepTech founders.
Authorship
Kartik Chugh
Cofounder, FORKOFF
Reviewed by: Kshitij JK
Last reviewed:
Published:
Methodology
Composite activity score computed across a 53-founder cohort over a 30-day observation window. PRIMARY scheme weights all four inputs equally at 0.25 each: posts per week, engagement rate, follower delta, and reply rate, rank-normalized across the cohort, with a 1000-iteration cluster-bootstrap 95% confidence interval per rank. A SECONDARY platform-aware scheme reweights to 0.25/0.35/0.20/0.20. Inclusion floor: 1000 or more followers and 4 or more original posts in the window. External framing draws on 45 cited data points from 23 named authorities.
Sources cited

AI Overview optimization is structural, not a domain-rating game. The 12 on-page patterns that make a page extractable and citable, with first-party data.

DeFi protocol marketing is a TVL problem. The 2026 playbook to take a protocol from zero to its first real Total Value Locked, backed by on-chain data.

DePIN marketing is a distribution and trust problem, not a hardware one. The 2026 playbook to take a network from testnet to a token it keeps using.