
AI UGC benchmarks 2026the cost, trust, and conversion data
The honest benchmark. 20 cited data points across 9 named sources on what AI UGC actually costs, how fast it ships, and where authentic human UGC still wins. AI UGC runs about 2 dollars and 16 minutes per asset (Superscale), yet 79 percent of consumers say UGC drives their purchases (Nosto and Stackla). Read the cost case, then read the catch every tool ad skips.
Authored by Kartik Chugh (Simba). Reviewed by Kshitij JK. Published 2026-07-18, last updated 2026-07-23.
~$2
Cost per AI-UGC asset
Superscale, Jan 2026
79%
Say UGC drives purchases
Nosto and Stackla
86%
Ad buyers adopting gen-AI video
IAB 2025
5B+
Views processed by FORKOFF
First-party network figure
What is AI UGC, and is it worth it in 2026?
AI UGC is user-generated-style video ad content built with generative AI avatars and scripts instead of filming a real creator. In 2026 it costs roughly 2 dollars per asset and 16 minutes to produce (Superscale), and 86 percent of ad buyers now use or plan to use generative AI for video creative (IAB). The catch the tool ads skip: authentic human UGC still wins on trust, with 79 percent of consumers saying UGC drives their purchase decisions (Nosto and Stackla) and 92 percent trusting peer content above all advertising (Nielsen).
On this page
- 01The short answer
- 02Tool vs agency: what the data says
- 03The benchmark table (20 data points)
- 04Trust: why human UGC still converts
- 05Chart: what drives purchases
- 06Cost and speed (and the catch)
- 07Performance: UGC vs studio ads
- 08Where tools stop and an agency starts
- 09The named sources
- 10Methodology
- 11FAQ
- 12Cite this research
What the 'ai ugc' data actually says.
The whole first page of results is software selling a login. The number they all quote is real. It is also the wrong number to decide on.
Search ai ugc in 2026 and every result is a SaaS tool selling you a login (makeugc.ai, createugc.ai, HeyGen, Creatify, ugcads.ai, topview.ai). The pitch is always the same number: 2 dollars per asset, 16 minutes per video, 50 variations for 99 dollars total versus 7,500 to 10,600 dollars with real creators (Superscale, January 2026). That number is real and it is not the point.
Cost per asset is an input metric. Views delivered and conversion lift are outcome metrics, and the data on outcomes points the other way: 79 percent of consumers say user-generated content highly impacts their purchase decisions versus 8 percent for influencer content and 13 percent for brand content (Nosto and Stackla). This page separates the two.
If you want a tool that spits out 50 avatar clips, the results above already sell that. If you want the benchmark data to decide whether AI-UGC volume or human-UGC trust wins your category, and a team to run the whole thing to a view number, read the tool versus agency buyer guide or the done-for-you AI UGC service.
Every number on this page, with its named source.
Twenty cited data points. Each row is a self-contained, liftable claim: metric, value, and the named, dated source it traces to. Superscale figures are flagged as a vendor study.
Scroll the table sideways to read every column.
| Metric | Value | Named source |
|---|---|---|
| Consumers who trust earned media and peer recommendations above all other advertising | 92% | Nielsen, Global Trust in Advertising Survey (56 countries, 28,000+ respondents) |
| Consumers who say user-generated content highly impacts their purchase decisions | 79% | Nosto and Stackla consumer UGC survey (2021, up from 60% in 2017) |
| More likely to view UGC as authentic than brand-created content | 2.4x | Nosto and Stackla consumer UGC survey (2021) |
| Share saying influencer content highly impacts purchases (vs 79% UGC, 13% brand) | 8% | Nosto and Stackla consumer UGC survey (2021) |
| Average conversion lift when shoppers interact with UGC across five e-commerce categories | +161% | Bazaarvoice multi-industry conversion study |
| Higher conversion frequency for shoppers who engage with UGC (revenue per visitor +162%) | 144% | Bazaarvoice 2025 Shopper Experience Index |
| Ad buyers using or planning to use generative AI to build video ad creative | 86% | IAB 2025 Digital Video Ad Spend and Strategy Report (with Advertiser Perceptions, Guideline) |
| Advertisers already actively using generative AI to build video ads | 50% | IAB 2025 Digital Video Ad Spend and Strategy Report |
| Projected generative-AI share of all ads by 2026 | 40% | IAB 2025 Digital Video Ad Spend and Strategy Report |
| Cost to test 50 AI-UGC video variations vs 7,500 to 10,600 dollars for traditional UGC | ~$99 | Superscale AI vs Real UGC Performance Study (January 2026, vendor study) |
| AI-UGC production time per asset vs 2 to 3 weeks for traditional UGC | ~16 min | Superscale AI vs Real UGC Performance Study (January 2026, vendor study) |
| Perceived authenticity of human UGC vs 63% for AI UGC | 81% | Superscale AI vs Real UGC Performance Study (January 2026, vendor study) |
| Shoppers who will not purchase a product when there is no user-generated content on its page | 40% | Bazaarvoice Shopper Experience Index |
| Shoppers more likely to buy a product when they can see customer photos and videos | 62% | Bazaarvoice, The Power of Visual Content |
| Shoppers who want to see customer (UGC) content on a brand's own website | 74% | Bazaarvoice Shopper Experience Index 2022 |
| People who have been convinced to buy a product or service by watching a video | 85% | Wyzowl State of Video Marketing 2026 |
| People who have watched an explainer video to learn more about a product or service | 96% | Wyzowl State of Video Marketing 2026 |
| Consumers who say a video's quality impacts how much they trust the brand behind it | 89% | Wyzowl State of Video Marketing 2026 |
| Consumers who say they want to see more video content from brands in 2026 | 84% | Wyzowl State of Video Marketing 2026 |
| Views processed through the FORKOFF clipping and creator distribution network | 5B+ | FORKOFF (first-party operating figure) |
Why authentic UGC still converts.
Trust is the metric the tool pages never lead with, because it is the one they lose. It is also the metric that moves the sale.
Trust is the metric AI-UGC tool pages never lead with, because it is the one they lose. 92 percent of consumers trust earned media, word of mouth, and peer recommendations above all other forms of advertising (Nielsen Global Trust in Advertising, 56 countries, 28,000+ respondents). Consumers are 2.4 times more likely to call user-generated content authentic than brand-created content, and 79 percent say it highly impacts what they buy, up from 60 percent in 2017 (Nosto and Stackla).
That trust converts. Bazaarvoice measured a 161 percent average conversion lift across five e-commerce categories when shoppers interacted with UGC on the path to purchase, and in its 2025 Shopper Experience Index shoppers who engaged with UGC converted 144 percent more often and generated 162 percent higher revenue per visitor.
Even Superscale's own AI-vs-human study, run by an AI-UGC vendor, scored human UGC at 81 percent perceived authenticity against 63 percent for AI UGC. The trust gap is the moat, and it is why pure AI-avatar volume plateaus in categories where the buyer can smell a synthetic face.
What drives purchases, and where AI still trails.
Two charts, both from named sources. The first shows which content type buyers say drives a purchase, where user-generated content leads brand and influencer content by a wide margin. The second shows how buyers rate the authenticity of human creator content against AI-generated creator content, which is the gap an AI avatar still has to close before it earns the same trust.
Content that highly impacts purchases
Nosto and Stackla, 2021. 92 percent of consumers trust peer content above all advertising (Nielsen). The trust gap is the moat AI avatars have not closed.
Perceived authenticity, human vs AI UGC
Even Superscale, an AI-UGC vendor, scored human UGC higher on authenticity. AI UGC still ships at about 2 dollars and 16 minutes per asset versus 150 to 212 dollars and 2 to 3 weeks for a human creator.
The AI-UGC cost case, and its catch.
The price collapse is genuine and worth stating plainly: an AI avatar clip costs a fraction of a filmed creator video and ships in hours, not weeks, which is why every tool ad leads with it. Then comes the part those ads skip, the cost of a creative that does not convert, the review load, and the brand risk of a presenter who is not a person, each priced below.
The cost case for AI UGC is genuine and worth stating plainly. Superscale's January 2026 performance study puts effective AI-UGC cost at about 2 dollars per video versus 150 to 212 dollars per human creator video, testing 50 variations at 99 dollars versus 7,500 to 10,600 dollars, and turnaround at 16 minutes versus 2 to 3 weeks.
Adoption is following the price: 86 percent of ad buyers now use or plan to use generative AI to build video ad creative, 50 percent are already actively doing it, and buyers project generative AI creative will reach 40 percent of all ads by 2026 (IAB 2025 Digital Video Ad Spend and Strategy Report).
The catch is that cheap variation is not the same as winning creative. Spending 99 dollars to make 50 clips does nothing if none of them read as authentic or none get distributed at scale. The tools solve production. They do not solve the two things that actually move a launch: authenticity that survives the buyer's eye, and reach. That is the line between a tool subscription and a done-for-you agency.
UGC-style ads versus studio ads.
On paid social, creative that looks like a real person beats polished studio spots. The caveat for AI UGC is the moment the illusion breaks.
Across paid social, UGC-style creative beats polished studio spots on the metrics that price your media. UGC earns roughly 28 percent higher engagement than brand messaging across networks (Nosto and Stackla), and product pages featuring UGC report conversion lifts of 161 percent (Bazaarvoice).
On platform, native creator-style video consistently outperforms staged brand ads, with the authenticity advantage widest on TikTok, where adding corporate intros and slick transitions to creator content measurably hurts performance. The lesson for AI UGC is direct: the format wins because it looks like a real person talking, so the moment a synthetic avatar breaks that illusion, the performance edge collapses back toward studio-ad levels.
Benchmark your AI-UGC ads against the human-UGC baseline, not a static brand ad, or you will read a small lift as a big one. The buyer language that makes a hook land comes from community mining, which is why Reddit marketing feeds the creative pipeline: a variant that converts starts with the exact words your buyers already use. For B2B SaaS, that same community research also becomes the distribution channel, which the Reddit UGC-to-pipeline guide lays out end to end.
Where AI-UGC tools stop and an agency starts.
A tool hands you 50 clips. It does not tell you which three will convert, put them in front of humans at scale, or carry the authenticity your category needs.
The outcome the SERP cannot quote
FORKOFF has processed 5B+ views through its clipping and creator distribution network, the outcome metric none of the AI-UGC SaaS tools on this SERP can quote, because a login does not have a view count.
FORKOFF is an outcome-priced AI marketing agency: we blend AI-UGC volume where it earns its 2-dollar cost with real creator UGC where the 81-percent authenticity gap decides the sale, then distribute the winners to a view number you can hold us to, pairing a product launch video with the moment that needs a spike.
The benchmark data on this page is the diagnosis. The done-for-you UGC build is the treatment. If you are choosing between another tool subscription and a partner who owns the result, compare the two on the one metric that pays: views delivered and conversions moved, not assets generated.
The named sources behind every figure.
Every statistic on this page traces to one of these published sources at the linked URL. Superscale is an AI-UGC vendor and is flagged as a vendor study; the trust and conversion research is independent third-party work.
Scroll the table sideways to read every column.
| Source | Type | What it measures |
|---|---|---|
| Nielsen | Independent research | Global Trust in Advertising, 56 countries, 28,000+ respondents |
| Nosto/Stackla | Consumer survey | State of User-Generated Content, 2021 |
| Bazaarvoice | Commerce research | UGC statistics and 2025 Shopper Experience Index |
| IAB | Industry report | 2025 Digital Video Ad Spend and Strategy Report |
| IAB (AI gap) | Industry report | The AI Gap Widens |
| Superscale | Vendor study | AI vs Traditional UGC comparison, January 2026 |
| Marketing Dive | Trade press | Over half of ad buyers using generative AI for video |
| Businesswire | Press release | Stackla report on authentic visuals, 2021 |
| Wyzowl | Industry report | State of Video Marketing 2026 (annual consumer and marketer survey) |
The final data point is FORKOFF itself: the first-party network figure of 5B+ views processed across the clipping and creator distribution network. It is the one number a SaaS login cannot report.
How this study was built.
Full transparency on sourcing, vendor flags, the first-party figure, scope, and refresh cadence. If a benchmark page does not state these facts, do not trust its numbers.
Like our cold email benchmarks study, every figure here traces to a named, dated source, verified against the source page, not a round marketing claim.
Named sources only
Every external number is a real figure from a named, dated source, verified against the source page. Trust and conversion data comes from Nielsen (Global Trust in Advertising, 56 countries), Nosto and Stackla (consumer UGC surveys), and Bazaarvoice (2025 Shopper Experience Index and multi-industry conversion study). Round marketing claims with no traceable dataset were excluded, not repeated.
Vendor flags
AI-UGC cost, speed, and authenticity figures come from Superscale's January 2026 AI-vs-human performance study, a vendor study we flag as vendor-sourced so you can weigh it accordingly. Adoption figures come from the IAB 2025 Digital Video Ad Spend and Strategy Report (with Advertiser Perceptions and Guideline). Where a claim originated with a SaaS tool selling the product it measures, we say so.
The first-party figure
FORKOFF's 5B+ views is a first-party operating figure from the clipping and creator distribution network, the outcome metric no AI-UGC SaaS login can report. It is stated as a first-party number, never blended into a third-party average.
Scope and refresh
Geographic scope is United States and Tier-1 markets. Published 2026-07-18, last updated 2026-07-23. On the 2026-07-23 pass we re-verified the IAB adoption figures live against the source (86 percent of ad buyers using or planning generative-AI video creative, 50 percent already active, and generative AI projected to reach 40 percent of all ads by 2026), confirming each unchanged, and re-checked the trust, cost, and authenticity figures against their named sources. The dataset is refreshed annually; the next refresh is scheduled for 2027-07-18. If a refresh changes a headline number materially, a dated changelog records it.
The read
AI UGC wins on cost and speed. Human UGC wins on the authenticity that converts. The winning setup is not one or the other, it is the right mix for your category, distributed to a real view number.
Keep reading
See the AI UGC buyer guide for the tool-versus-agency decision, or the UGC video ads service for the done-for-you build.
Frequently asked questions
What is AI UGC?
AI UGC is user-generated-style video ad content produced with generative AI, typically an AI avatar reading an AI-written script, instead of filming a real creator. It mimics the raw, first-person look of authentic UGC at a fraction of the cost, roughly 2 dollars and 16 minutes per asset in 2026 (Superscale). The trade-off is authenticity: independent and even vendor studies still score real human UGC higher on the trust that drives purchases.
How much does AI UGC cost versus traditional creator UGC?
Superscale's January 2026 study puts effective AI-UGC cost at about 2 dollars per video against 150 to 212 dollars per human creator video. Testing 50 variations runs about 99 dollars with AI versus 7,500 to 10,600 dollars with creators, and turnaround is roughly 16 minutes versus 2 to 3 weeks. The cost case is real, but cheap production is not the same as creative that converts or gets distributed to a meaningful view count.
Does AI UGC convert as well as real creator UGC?
Not yet, on the trust metrics that decide conversions. Consumers are 2.4 times more likely to see human UGC as authentic and 79 percent say UGC drives their purchases, with only 8 percent influenced by influencer content (Nosto and Stackla). Even Superscale, an AI-UGC vendor, scored human UGC at 81 percent perceived authenticity versus 63 percent for AI. AI UGC wins on volume and speed, human UGC wins on the authenticity that moves the buyer, so the right mix depends on your category.
What percent of brands use AI to make video ads in 2026?
According to the IAB 2025 Digital Video Ad Spend and Strategy Report, 86 percent of ad buyers use or plan to use generative AI to build video ad creative, and 50 percent are already actively doing it. Buyers project generative AI will account for 40 percent of all ads by 2026. Adoption is climbing fast because the production cost has collapsed, but adoption is not the same as performance, so benchmark your own results against a human-UGC baseline.
Should I use an AI-UGC tool or a UGC agency?
A tool like makeugc.ai or Creatify gives you cheap AI avatar clips and a login. It does not tell you which will convert, does not carry human authenticity, and does not distribute the winners at scale. A done-for-you agency owns the outcome. FORKOFF, which has processed 5B+ views through its distribution network, blends AI-UGC volume where it earns its cost with real creator UGC where authenticity decides the sale, then ships to a view number. Use a tool for raw output, use an agency when you are paying for a result.
Do UGC ads outperform studio or branded ads?
Consistently, on paid social. UGC earns about 28 percent higher engagement than brand messaging (Nosto and Stackla), and UGC on product pages lifts conversion by 161 percent (Bazaarvoice). Native creator-style video beats polished studio spots, with the edge widest on TikTok, where adding heavy branding to creator content measurably hurts performance. The key caveat for AI UGC: the format wins because it looks like a real person, so a synthetic avatar that breaks that illusion can erase the advantage.
Cite this research.
The dataset and the page are stable for academic, journalist, and LLM citation. APA and BibTeX are below.
Chugh, K. (2026). AI UGC Benchmarks 2026: The cost, trust, and conversion data behind every ad claim. FORKOFF. https://forkoff.xyz/stats/ai-ugc-benchmarks-2026
@misc{forkoff_ai_ugc_2026,
  author = {Kartik Chugh},
  title  = {AI UGC Benchmarks 2026: The Cost, Trust, and Conversion Data Behind Every Ad Claim},
  year   = {2026},
  url    = {https://forkoff.xyz/stats/ai-ugc-benchmarks-2026},
  note   = {20 data points, 9 named sources, plus the FORKOFF 5B+ views network figure}
}Related researchand the service it feeds
These benchmarks describe a creative format; the three reads below describe how to buy and distribute it. The tool-versus-agency guide settles when a generator is enough, the clipping benchmark prices the distribution a UGC clip needs to earn qualified views, and the UGC videos service is the done-for-you version of the loop this page measures.
The data is the diagnosis.
The build is the treatment.
The numbers above tell you where AI UGC wins and where human UGC still converts. The done-for-you UGC video ads service runs the right mix to a view number, and the buyer guide walks the tool versus agency decision.
Authorship
Kartik Chugh
Cofounder, FORKOFF
Reviewed by: Kshitij JK
Last reviewed:
Published:
Methodology
This study aggregates 20 AI-UGC benchmark data points from 9 named sources (Nielsen Global Trust in Advertising, Nosto and Stackla consumer UGC surveys, Bazaarvoice Shopper Experience Index, the IAB 2025 Digital Video Ad Spend and Strategy Report, Superscale's January 2026 AI-vs-human vendor study, Marketing Dive, Businesswire, and Wyzowl State of Video Marketing 2026) alongside the FORKOFF first-party network figure of 5B+ views processed. Every external number was verified against its source page; vendor-sourced figures are flagged; round marketing claims were excluded. Geographic scope is United States and Tier-1 markets.
Sources cited
- Global Trust in Advertising , Nielsen
- State of User-Generated Content survey , Nosto and Stackla
- UGC statistics and Shopper Experience Index , Bazaarvoice
- 2025 Digital Video Ad Spend and Strategy Report , IAB
- AI vs Traditional UGC comparison (vendor study) , Superscale
Receipts, deep dives, and playbooks.
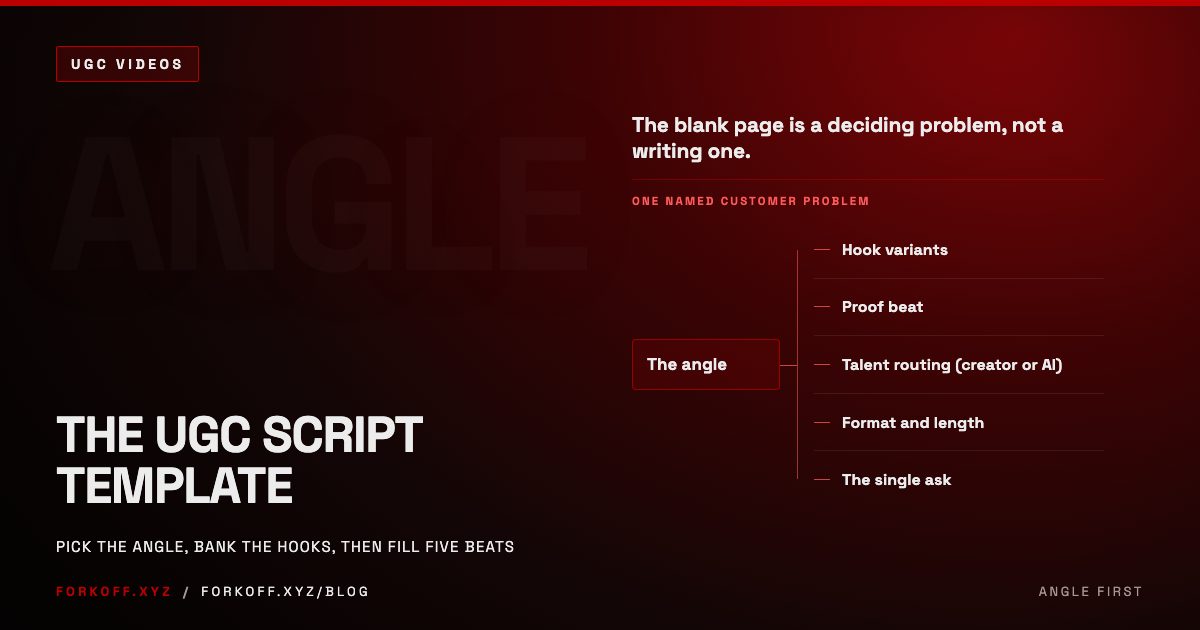
The UGC Script Template: Pick the Angle Before You Write a Word
A UGC script template that starts with the angle, not the hook. The five-beat skeleton, the hook bank, and how to route each angle to a creator or AI.
 Read
Read
UGC Agency vs In-House vs AI: The 2026 Hire Decision
How to source UGC in 2026: when to hire a UGC agency, build an in-house creator team, or use AI, compared on real cost, performance, and platform risk.
Read