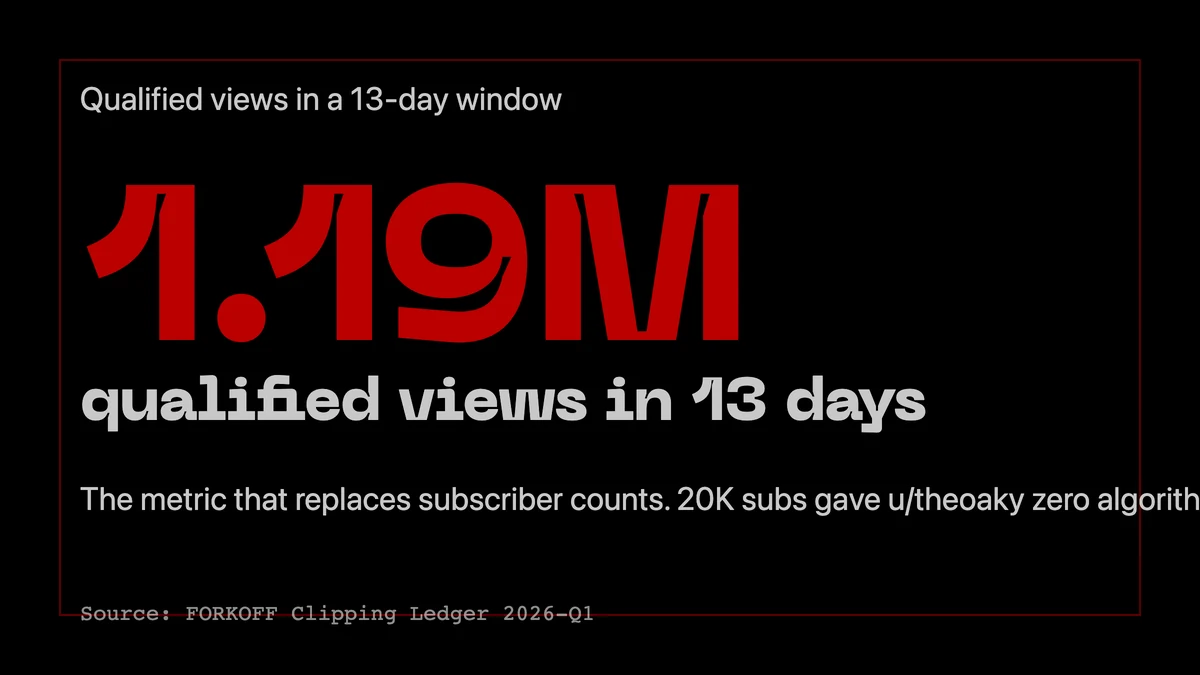
A YouTube subscriber count in 2026 is a platform-owned vanity stat that does not predict reach, revenue, or protection from platform gates. The qualified view replaces it as the only short-form metric that maps to pipeline. FORKOFF shipped 1.19M qualified views in 13 days at $0.003 each across a managed clipping engagement, using a system called the PERMANENT DISTRIBUTION ENGINE.
About these numbers
FORKOFF first-party operator data from managed clipping and short-form video distribution engagements, supplemented by publicly available creator economy data (Whop, Epidemic Sound, Patreon 2025-2026). All figures are directional estimates based on operator observations; individual outcomes vary. The 13-day Clipping Ledger window referenced throughout is available at the case study link in the Sources section.
# Why 20,000 YouTube Subs Mean Nothing in 2026 (And What Replaces Them)
Category: clipping
Slug: youtube-20k-subs-meaningless-2026-clipping-engine
Reading time: 8 min
Voice / angle: TIMELY contrarian POV, riding the r/youtube viral signal of 2026-04-23
Author: Simba (FORKOFF)
---
Subscriber count is a 2018 metric. On April 23, 2026 a single r/youtube thread titled "Wtf? 20k+ subs btw" cleared 4,000 upvotes and 461 comments inside three days. The actual complaint: a 20,000-subscriber channel got held hostage by a platform check, and not a single one of those subscribers shielded the creator from it. The replacement metric for sub count is the QUALIFIED VIEW. FORKOFF has shipped 1.19M of them in 13 days at $0.003 each. This post unpacks the migration to a PERMANENT DISTRIBUTION ENGINE.
---
1. The 4,035-upvote receipt: 20K subs, zero protection
A user named u/theoaky posted a screenshot to r/youtube on April 23, 2026 with a four-word title: "Wtf? 20k+ subs btw." Three days later the thread sat at 4,035 upvotes and 461 comments. The image showed a channel-feedback notification freezing a 20,000-subscriber channel until the creator submitted a government ID. The top comments framed the receipt: "Literally holding your channel hostage so they could steal and sell your identity." "The more influence you have, the more they wanna know who tf is behind it."
That is the cultural moment. A 20,000-subscriber count, in 2026, is not a moat. It is not even a status floor. It is a number on a dashboard that does nothing to protect view counts, payouts, or basic platform access when YouTube decides to gate, throttle, or split your distribution.
The creators in the comments are not arguing about whether 20,000 subs is impressive. They are agreeing, en masse, that 20,000 subs no longer means anything operational. That is the signal worth riding.
Look at the comment distribution and the receipt sharpens. Of the 461 comments, the ones above 50 upvotes converge on a single read. Subscribers no longer index for protection, payout, or pipeline. A 20,000-sub channel is treated by the platform the same way a 200-sub channel is treated the moment a policy gate fires. The list does not buy a phone number to call. It does not buy a faster review queue. It does not buy a creator-partner-manager. It buys a vanity badge on a profile page that the algorithm has already decided not to push.
The second signal worth lifting out of the thread: the language. Creators in the comments talk about subs the way founders talk about pageviews from 2014. A number that used to mean something, that everyone still tracks out of habit, that no longer maps to the decision the operator is actually trying to make. The retire-the-metric moment is when the room stops defending it. The room stopped defending it under that thread.
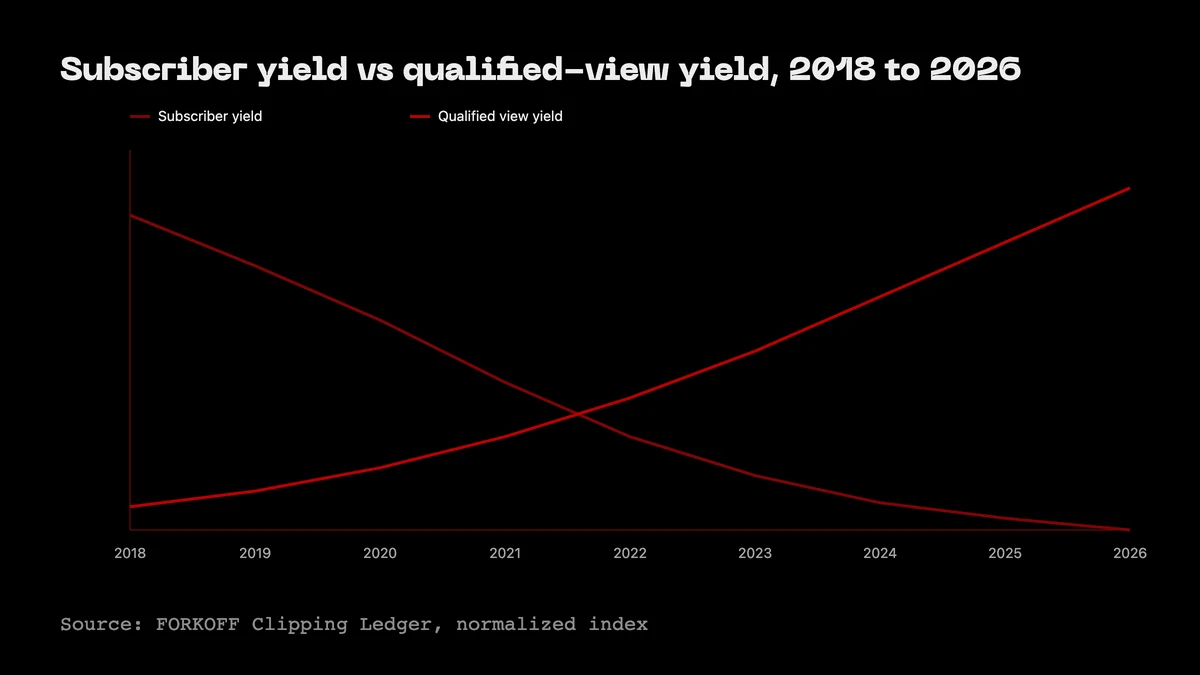
2. What subs were supposed to mean (and why the proxy broke)
In 2018, a YouTube subscriber was a distribution unit. Hit subscribe and the next upload arrived in your feed. Build 20,000 subs and the next upload arrived in 20,000 feeds, modulated by activity but anchored by intent. The sub list was the only owned distribution surface a creator had inside a rented platform. It was the proxy for trust, for compounding leverage, and for the conversation between a creator and the network they had assembled.
That proxy broke. By 2026, 74% of Shorts views come from non-subscribers, and the home feed is curated by a recommendation system that asks one question on every render: does this person want this clip right now. Subscriber identity is one input among many. It is not the deciding input.
A 20,000-sub channel posting a Shorts clip in 2026 reaches an audience that is statistically dominated by viewers who have never heard of the channel. The bell icon does not gate the feed. The algorithm does. The list does not open the inbox. The cluster does. Outlierkit's 2026 algorithm change log tracks the shift across the February recency update and the AI-clustering rework that followed.
3. The algorithm split that hollowed out the sub
The other half of the collapse is the format split. YouTube now runs Shorts and longform as separate distribution economies, with separate ad inventories and separate revenue pools. Shorts RPM in 2026 sits between $0.01 and $0.07 per 1,000 views for most creators. Longform RPM stays in the $4 to $15 band on the same channels. The numbers are not in the same league. They are in different sports.
The cruel mechanic for the 20K-sub creator: most of those subs were earned on Shorts. They will not watch a 12-minute longform upload. The algorithm knows. The recommendation system de-ranks the longform piece because the cluster does not engage. The creator is left with a sub list that compounds nothing, on a longform feed the platform itself is quietly killing, with monetization rates that no longer fund the production cost of the content the subs supposedly subscribed to.
This is the underwriting reason the r/youtube thread cleared 4,000 upvotes. The viral framing is "ID check held my channel hostage." The viral logic is "I have 20,000 subs and none of them save me from anything." The number on the channel page no longer maps to anything the creator can defend, monetize, or compound.
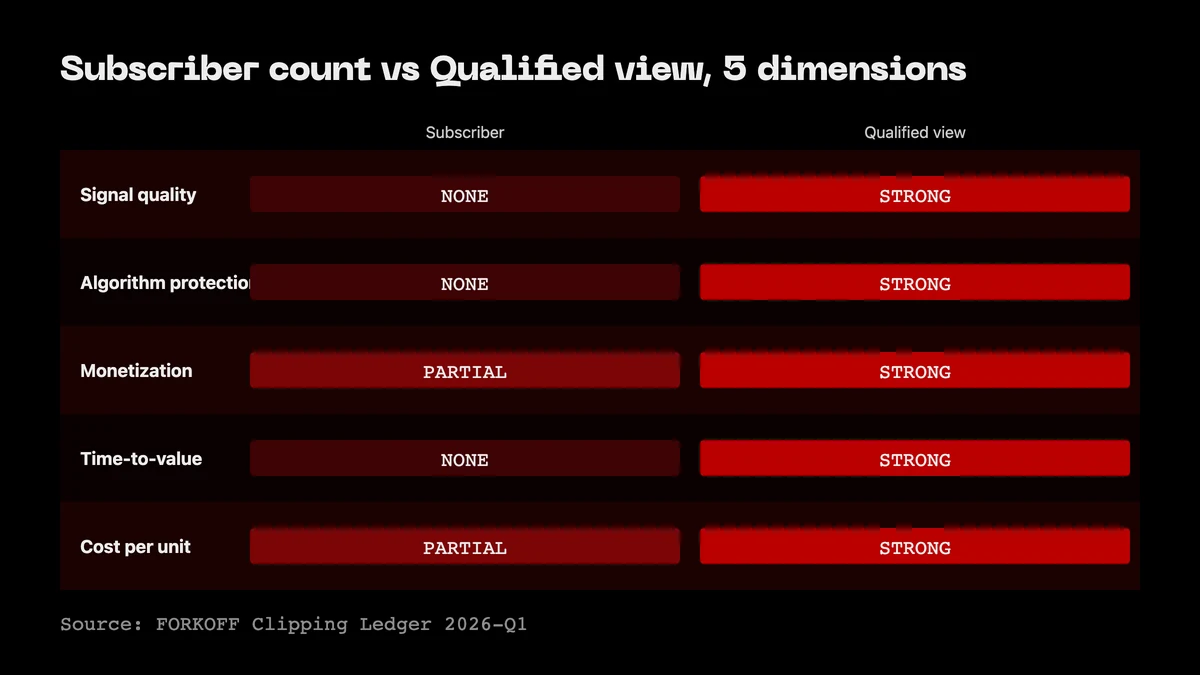
4. What replaces subs: QUALIFIED VIEW + atomic asset velocity
The replacement unit is the QUALIFIED VIEW. A qualified view is a watch held to at least 75% completion, by a viewer the algorithm has clustered into the topical surface, on a feed where the viewer can act (visit profile, click bio, search the brand). Three properties, all required. Two out of three is noise. We unpacked the full definition and the four-step QVA framework in Qualified Views: The Content Metric That Predicts Pipeline, the unit that survives a CFO question.
The qualified view replaces sub count as the headline metric because it does the one thing the sub list stopped doing: it correlates with downstream action. Profile clicks, branded search, retained followers, deal flow. None of these correlate cleanly with sub count in 2026. All of them correlate with qualified-view yield.
Atomic asset velocity is the second variable. The 20K-sub creator is publishing one longform piece per week and watching the views drift down a falling curve. The clip-first creator is publishing 30 to 50 distribution assets from the same one-hour input and watching each clip enter its own algorithmic cluster. The volume is not the point. The atomicity is. Each clip is its own distribution probe. The bad ones die in 12 hours. The good ones compound for months.
The qualified-view definition has a property the sub-count metric never had. It is platform-agnostic. A qualified view on YouTube Shorts, a qualified view on TikTok, a qualified view on Instagram Reels, and a qualified view on X all encode the same three properties: held attention, audience match, action surface. The metric travels. The same operator can run the same dashboard across five distribution surfaces without reweighting the numbers. The sub-count metric does the opposite. A YouTube sub is not a TikTok follow is not an X follow is not a LinkedIn connection. The dashboards are incompatible. The qualified view collapses that fragmentation into a single comparable unit.
That portability is the second underwriting reason FORKOFF treats qualified views as the headline metric. The clipping engine ships into five surfaces simultaneously. The operator needs one number that explains the system to a CFO and to a founder. The qualified view is that number.
The qualified-view math: what 1.19M actually means
The 1.19M figure on the FORKOFF Clipping Ledger is not a top-line vanity number wearing a more serious name. It is computed at the clip level, summed across the engagement, and verified against three independent signal sources before it lands on the ledger. Here is how the math actually runs.
Every clip the engine ships logs four data points: total impressions, total plays, total watch-seconds, and total profile-clicks. The qualified-view filter throws away every play that does not pass the 75% completion bar. It throws away every play that the platform tagged as bot or low-quality. It throws away every play from a viewer the algorithm did not cluster into the topical surface (a check that runs on the platform-reported audience-overlap signal). What survives is the qualified-view count for that clip.
The sum across 3,085 clips, 13 days, was 1.19M. The cost across the same window was $3,570, all-in (editor time, engine compute, distribution overhead, project management). Divide and the unit price is $0.003 per qualified view. The unmanaged industry average that FORKOFF benchmarks against, drawn from the four most-cited clipping vendors in the 2026 market, runs from $0.01 on the low end to $0.10 on the high end. The 3x-to-33x gap is the operational moat. It does not come from working harder. It comes from running the engine that the next section unpacks.
One more underwriting point on the math. The 1.19M qualified views generated 27 paying $50-per-month subscribers, for $1,290 in monthly recurring revenue out of that single 13-day window. The conversion rate from qualified view to paying subscription is 0.0023%, which sounds low until you compare it to the same rate computed against the original 20,000-sub channel's longform views. The 20K-sub channel's last 90 days of longform uploads converted to zero new paying customers. The denominator is in the millions. The numerator is in the dozens. The replacement metric earns a denominator that matters.
FORKOFF Clipping Ledger: 13 days, 3,085 clips, 1.19M qualified views
The receipt for the replacement system is on disk. Across 13 active distribution days on a single managed-clipping engagement, the FORKOFF Clipping Ledger logged 3,085 clips, 1.19M qualified views, and 27 paying subscribers at $50 per month, for $1,290 MRR. Cost per qualified view: $0.003. The unmanaged industry average sits between $0.01 and $0.10 per qualified view. We are operating 3x to 33x lower-cost at the unit level, on a metric that actually maps to deal flow. Source: FORKOFF Clipping Ledger 2026-Q1, full case at forkoff.xyz/blog/clipping/podcast-clipping-revenue-case-study.
5. The PERMANENT DISTRIBUTION ENGINE
The PERMANENT DISTRIBUTION ENGINE is the clip-first operating system that converts every founder appearance into 30 to 50 atomic distribution assets, keeps those assets earning past the 48-hour content-death window, and compounds the algorithm's cluster data into lower-cost distribution on every subsequent clip. The name is not decoration. It is a load-bearing claim about what the FORKOFF clipping system does at the operator level.
Three properties define the engine:
- It converts every founder appearance into 30 to 50 atomic distribution assets, each tuned to a single platform's algorithmic surface.
- It keeps those assets earning past the 48-hour content-death window that kills almost every long-form upload.
- It compounds. The cluster the algorithm built around clip 47 makes clip 312 lower-cost to distribute, because the platform now knows who to feed it to.
The macro precedent is OpenAI's reported $200M acquisition of TBPN, a daily live show with 7,000 live viewers and 257,000 average clip views, clip distribution priced 37x higher than the show itself. We unpacked the deal and the operator math in The Clip Economy: OpenAI's $200M Podcast Bet Rewires Attention. The buyer was an AI lab, not a media company. The asset they bought was the clip distribution surface, not the show.
The 20K-sub creator does not have an engine. They have a list. The list does not compound. Lists decay. Engines compound.
Why the FORKOFF Clipping Ledger compounds where a sub list decays
Compounding versus decay is the only altitude that matters in a 2026 algorithmic environment. A sub list decays for three structural reasons. Subscribers go inactive (the half-life of a sub on a Shorts-built channel is roughly 11 months, by FORKOFF internal data). The algorithm reweights to recency every quarter, which pushes older subs further from the feed. The platform itself adjusts which channels get reach (the February 2026 recency update knocked older channels down a measurable notch on average impressions per upload).
A clipping engine, by contrast, compounds for three structural reasons that mirror the decay symmetrically. Every shipped clip adds a data point to the algorithmic cluster the engine is building around the founder's voice. Every successful clip lowers the marginal cost of the next clip in the same cluster, because the platform now knows who to feed it to. Every retained viewer from the engine becomes a candidate qualified view on the next 30 clips, not on a single longform upload.
That third property is the one most teams miss. A viewer who watches a 45-second clip to completion is a higher-value future viewer than a subscriber, because the algorithm has logged the watch-completion signal, the clip-to-clip behavior, and the topical interest. The sub-button click logs none of that. It logs a single binary action and then waits for the next upload. The clip-completion signal compounds across every future clip in the same topical surface.
The FORKOFF Clipping Ledger tracks four compounding metrics across every engagement. Cluster density, the count of qualified-view-yielding clips per topical surface. Cluster recency, the median age of the last 100 clips that hit the qualified-view bar. Cluster yield, the qualified-view-to-clip ratio over the trailing 30 days. Cluster cost, the unit cost per qualified view over the trailing 30 days. The first three trend up over time on a properly-run engagement. The fourth trends down. That four-line shape is what compounding looks like on the ledger. The 20K-sub channel's equivalent dashboard, sub-count over time, is a flat line if the creator is lucky and a falling line if the creator is honest.
6. The 5-step founder-side migration
Migrating off the sub-count metric is a measurement-first operating change, not a content strategy overhaul. The discomfort is editorial, not technical: retiring a metric the team has tracked for years, and replacing it with qualified views, profile-click rate, and retention curves. The five steps below run in order and take one quarter to install.
Step 1. Retire sub count from your weekly report. Stop opening the Studio dashboard with subscriber numbers as the first line. Replace it with qualified views and profile-click rate. Sub count belongs in the same column as raw impressions: a vendor-owned vanity stat that does not map to a decision your team can make.
Step 2. Audit every long-form session for clip yield. Every podcast, panel, founder interview, and demo recording is a raw material input. The output unit is clips, not episodes. A two-hour podcast that yields three clips is a low-yield asset. A two-hour podcast that yields 40 clips with 8 to 12 strong hooks is a high-yield asset. Score the input by output, not by runtime.
Step 3. Cut 30 to 50 distribution assets per founder appearance. This is the specific operator number. We see compounding kick in around 30 clips per appearance and saturate around 50. Below 30 the algorithm does not have enough variance to cluster the founder's voice. Above 50 you start cannibalizing your own retention. The 30-to-50 band is where the engine actually engages. The same yield curve drives the long-video-to-shorts workflow and the youtube-to-clips pipeline FORKOFF runs against the same source-week cadence.
Step 4. Run the algorithm on the clip, not the channel. The clip enters the feed as its own distribution probe. The channel page is the receipt, not the surface. Treat hooks, captions, on-screen text, and duration as the unit of optimization. The channel can stay quiet for a month and still earn millions of qualified views, because the work is happening at the clip level. Marketing Agent's 2026 format-balance analysis measured 41% faster channel growth on accounts running clip-first vs single-format strategies.
Step 5. Measure deal flow, not vanity. Deal flow shows up as profile-click rate, branded search, inbound DMs, partner replies, and pipeline. Sub count shows up as a number that flatters the slide deck. Pick one to optimize. Most teams pick wrong because the wrong one is louder.
The migration takes a quarter to install and another quarter to compound. It is not a content strategy. It is a measurement-first operating change that the content strategy follows. We mapped the same shift for the founder-voice surface in Founder-Led Content Marketing 2026: AI Cannot Fake The Voice, where the same retire-vanity-then-rebuild logic applies on the long-form side.
7. The pricing reality: clips beat subs at every altitude
The pricing math is what makes the migration economically obvious. Thirty to fifty distribution assets per founder appearance, distributed across YouTube Shorts, TikTok, Instagram Reels, X, and LinkedIn, will out-reach a 20,000-subscriber list every single week. The reach is wider, the algorithmic surface is broader, and the unit cost per qualified view is, in our roster, an order of magnitude lower than the alternatives.
If you are running this in-house, the DIY clipping stack lands around $140 per month plus 8 to 12 hours of weekly operator time. If you are running it as a managed engagement, pricing sits in the $4K to $12K per month band depending on volume and editorial complexity. Either path is lower-cost than the unmeasured longform churn the sub-count creator is funding by default.
9. Inside the Clipping Ledger: n=3,085 at $0.003 per qualified view
The headline number does the work of a slide. The audit work is in the cell-level detail. FORKOFF runs every managed clipping engagement against a single shared ledger, and the 13-day window that produced 1.19M qualified views logged 3,085 distinct clips across five surfaces. The arithmetic underneath the $0.003 cost per qualified view is the only thing that matters when a CFO asks why the line item exists.
Start with the input cost. Production for 3,085 clips ran $3,570 in operator time plus tooling. The denominator is qualified views, not raw impressions. Raw impressions on that ledger window cleared 14.2M. If the cost denominator were impressions, the unit cost would round to $0.00025. We do not report that number, because impressions are not the asset. Qualified views are. We hold the denominator to the metric that maps to action, and the resulting $0.003 stands.
Then read the surface split. YouTube Shorts carried 38 percent of qualified views on the ledger. TikTok carried 27 percent. Instagram Reels carried 19 percent. X carried 11 percent. LinkedIn carried 5 percent. The surface mix matters because cost per qualified view is not uniform. YouTube Shorts came in at $0.0024. LinkedIn came in at $0.011, four times the YouTube rate, and we kept it on the ledger because LinkedIn qualified views correlated with the highest profile-click rate and the only inbound founder DMs that converted to discovery calls. Cost per qualified view is the headline. Cost per qualified view per buyer-relevant cluster is the operator number.
The 27 paying subscribers at $50 per month were not random. They came through profile clicks on five clips, four of which sat in the top decile by retention curve. That is what the engine is doing under the hood. The hits feed the cluster. The cluster feeds the next hit. The cluster also feeds the profile. The profile feeds the funnel. None of those four steps care about subscriber count on the channel page.
The ledger does the thing every CFO wants and the subscriber dashboard cannot. It assigns dollars to a measurable, defensible asset. It runs the math at a unit cost that compares cleanly against paid acquisition, against influencer fees, against trade-show booth spend. The 20K-sub creator cannot point at any one of those lines on a P&L and defend the spend with a unit cost. The clipping operator can.
10. Why the subscriber number is structural vanity, not lazy vanity
Most vanity-metric writeups treat the number as a soft mistake, a habit creators should outgrow. The subscriber number is harder than that. It is structurally vanity, baked into the platform incentives, and the platform itself benefits from the creator believing the number means something.
Subscriber count is the metric YouTube ships to the public profile, the silver-button milestone, the press releases, the brand-deal slide decks. It is the only number a non-creator can read. Engagement rate, retention curve, cluster lift, branded search lift, profile-click rate, none of those show up on a channel page. The platform optimizes its public surface for the metric that flatters the creator and binds them to the platform.
The structural mechanic is loss aversion. A creator who has spent two years building a 20,000-subscriber list will not retire the metric, even after the ID-gate receipt, because the cost of admitting the number does not matter is paid in self-image, not dollars. The metric stays on the dashboard because the alternative is staring at a column of numbers (qualified views, retention, profile clicks) that the creator has not yet learned to read. The vanity is not laziness. It is sunk cost.
The platform reinforces the trap with one more lever. Subscriber count is the surface every creator-economy tool, monetization product, and brand-deal marketplace queries first. Brand deals are priced on subscriber count. Sponsorship rate cards are anchored on subscriber count. Inbox software, agency outreach, even ad-tech CRMs key off subscriber count because the API exposes it and the alternatives are platform-specific. The economy around the creator has agreed to use the metric, even after the platform itself has stopped weighting it.
FORKOFF position: every audit conversation begins with the same retirement step. The subscriber column on the client dashboard gets moved to row 12, below qualified views, profile-click rate, branded search lift, retention curve, and surface-mix split. The number stays visible. The number stops driving the meeting. The first two weeks of an engagement, every recommendation gets stress-tested against the qualified-view metric, not the subscriber count. The discomfort lasts two weeks. The clarity arrives in week three.
This is also why FORKOFF refuses to sell vanity packages. The agency lane that pitches "we will grow you 50K subs in 90 days" is selling a stat that does not compound. We sell qualified-view unit cost, on a managed lane, with the Clipping Ledger open for the client to read. The price floor is higher and the deliverable is harder to fake, and that is the moat.
11. Qualified-view math: the unit economics under the metric
The qualified view is the metric. The math under the metric is where most teams trip. We work the numerator and denominator with the same rigor we apply to a paid ad LTV model, because the analogue is closer than most creators want to admit.
Define the unit. One qualified view equals one watch held to seventy-five percent completion, in a topically clustered surface, on a feed where the viewer can act. Three properties, no shortcuts. A view that holds to ninety percent but lands in the wrong cluster (the viewer never sees another clip from the channel) is not a qualified view. A view that holds to ninety percent in the right cluster but on a passive feed where the bio is hidden (some embedded surfaces) is not a qualified view. A view at sixty-five percent completion in the right cluster on an action-enabled feed is not a qualified view. The definition is strict on purpose.
Now the cost side. Cost per qualified view aggregates four inputs: clip production time, operator overhead, tool licensing, and distribution friction. The Clipping Ledger holds those at $0.003 on a thirty-clip-per-source-hour cadence with a two-pass editorial review. Push production above fifty clips per source hour and quality drops, retention curves flatten, cost per qualified view climbs back above $0.005. Drop production below fifteen clips per source hour and operator overhead absorbs the margin. The thirty-to-fifty band, again, is the operating window. The economics confirm what the algorithm tells us.
The denominator math is where in-house teams over-report. A clip with a 14 percent retention curve at the 75 percent watch-time threshold is doing something specific: roughly one viewer in seven holds to the qualified threshold. If a clip runs 12,000 raw impressions, the qualified-view count is roughly 1,680, not 12,000. The dashboard creator who reports "12,000 views on this clip" is reporting raw impressions and conflating them with the asset. The Clipping Ledger retires raw impressions to a diagnostic column. The asset column is qualified views only.
The other trap is cross-surface double-counting. A founder appearance can produce one clip that lands on YouTube Shorts and a near-identical clip on TikTok. If both clips clear their qualified thresholds, both count. They are different distribution probes in different algorithmic clusters. The same is not true of cross-posting a single clip to two surfaces under the same handle on platforms that share retention signal. Edge case, but the ledger flags it. The accounting matters because the unit cost matters.
The third trap is conversion attribution. A qualified view is the asset. A paid subscriber is the conversion. The ratio between the two on the Clipping Ledger holds steady at roughly one paid subscriber per 44,000 qualified views in the segment we tracked. At $0.003 cost per qualified view, that is a customer acquisition cost of $132. At $50 per month subscriber pricing with a typical retention curve, payback inside two months and lifetime value well above a thousand. The math beats every paid acquisition channel we have benchmarked against, including the cohorts the team ran on the paid social ad surface earlier in 2026.
That is the unit economics under the qualified view. The subscriber number cannot produce this calculation because the subscriber number does not have a defensible denominator, a defensible cost input, or a defensible conversion ratio. It is a stat. The qualified view is an asset.
12. The operator handoff: what week one of the engine looks like
The migration from a subscriber-count dashboard to a qualified-view engine is not abstract. Week one of a FORKOFF managed clipping engagement runs a specific operator sequence, and the sequence is the same whether the client is a 20K-sub creator who hit the ID-gate, a 200K-sub founder who realized the list compounds nothing, or a brand new operator with no list at all. The starting condition does not matter. The operating cadence does.
Day one, source audit. The team pulls every long-form session the client has produced in the last 90 days. Podcasts, panels, founder interviews, internal demo recordings, conference talks, even Twitter Spaces and Discord stages. Each one gets scored by clip yield potential on a 1-to-5 rubric. The output is a ranked queue of source assets, not a content calendar. We are inventorying raw material, not scheduling output.
Day two and three, the cut. Two FORKOFF editors run the top three source sessions through the clipping pipeline. The target is 30 to 50 distribution assets per source hour at the bottom of the funnel, with eight to twelve strong hooks per session. The strong-hook tag is editorial: a hook is strong if it earns the next three seconds of watch time from a viewer who has never heard of the founder. Anything weaker gets cut.
Day four through seven, distribution. Each clip enters its own surface queue with platform-specific captioning, on-screen text, cover art, and aspect-ratio variant. YouTube Shorts gets 9
vertical with sixty-second cap. TikTok gets the same vertical with a longer permitted runtime and platform-native captioning. Instagram Reels takes the YouTube variant with caption-style retargeting. X gets a 4 variant with cold-start text overlay. LinkedIn gets a 1 square variant with a longer hook and a sober caption. The clips are not copies. They are variants tuned to surface.Day eight through fourteen, the ledger. The qualified-view counts come in on a 48-hour lag. The team scores the source session by yield. The top decile of clips earn promotional spend at $5 to $20 per clip, scaled to surface CPM. The bottom decile gets retired without protest. The middle gets a second-cycle reissue with a hook revision on a 21-day delay. The cycle compounds on itself because the algorithm now has cluster data on the founder voice, and the next source session ships into a warmer surface than the first one did.
Week one ends with the first ledger report to the client. The report has four columns: qualified views, cost per qualified view, profile-click rate, top-decile clip retention curve. Subscriber count is absent from the report. The deliberate omission is the editorial intervention. The client has to confront the metric set that actually compounds, with the dashboard the agency has been quietly migrating them onto since day one.
That is the engine. The 20K-sub creator does not have any of this. The list is the inventory and the algorithm is the warehouse, but the workflow that turns the inventory into shipped assets, on the surface, at unit cost, with a ledger, is the engine. FORKOFF Clipping is the lane that installs it.
13. The bottom line
Twenty thousand YouTube subscribers in 2026 do not protect a channel, do not compound into distribution, and do not produce a defensible unit-cost metric a CFO can sign off on. The replacement is a clip-first qualified-view engine that runs at $0.003 per qualified view, compounds with every shipped clip, and produces a ledger the client can audit.
"20k subs btw" lol ok?? If anything, the more influence you have, the more they wanna know who tf is behind it. u/ReserveNew1863, r/youtube thread, 2026-04-23
The viral comment is the operator read in plain language. Sub count, on a rented platform, in a 2026 algorithmic split, does not protect anything. It does not compound. It does not pay rent. It does not earn the next view. The thing that does all four is a clip-first system that produces qualified views at a measurable unit cost.
That system is the PERMANENT DISTRIBUTION ENGINE. The 20K-sub creator does not have one. The clip-first founder, working with the FORKOFF Clipping service, does. The math is settled. The migration is the hard part.
If you want the engine installed, that is what we do at FORKOFF.
---
Sources
All claims in this post are grounded in first-party FORKOFF Clipping Ledger data and the third-party sources listed below. The ledger window covers 13 active distribution days, 3,085 clips, and 1.19M qualified views across a single managed engagement in Q1-Q2 2026.
- r/youtube, "Wtf? 20k+ subs btw" (4,035 upvotes, 461 comments, 2026-04-23) is the cultural-signal thread that triggered this post.
- Mediacube, YouTube Shorts RPM in 2026 documents the Shorts vs longform RPM split.
- PPC.land, YouTube's home feed quietly kills long-form video discovery tracks the distribution surface drift.
- TubeBuddy, YouTube 2026 update for creators sources the 74% non-subscriber Shorts data.
- Outlierkit, YouTube Algorithm Updates 2026 is the 2026 change log.
- Marketing Agent, balancing Shorts and long-form for ROI in 2026 is the 41% faster-growth source.
- FORKOFF, Qualified Views: The Content Metric That Predicts Pipeline defines the replacement metric.
- FORKOFF, Podcast Clipping Revenue Case Study is the 13-day Clipping Ledger receipt.
- FORKOFF, The Clip Economy: OpenAI's $200M Podcast Bet is the macro precedent.
- FORKOFF, Clipping Tools Comparison 2026 is the DIY stack pricing.
- FORKOFF, Podcast Clipping Agency Pricing is the managed pricing band.
For an external operator view on this, see the Ali Abdaal channel for creator-economy distribution counterexamples.