
CPQV in three modes: budget, CPM gap, podcast.
One tool for every cost question in a clipping campaign. Estimate qualified-view delivery from a budget, convert a marketplace CPM into its true effective CPQV, or run podcast-specific pricing at FORKOFF's $0.003 anchor. Calibrated against the 5Bn+ view ledger and growing.
Why effective CPQV is the only honest cost metric.
CPM looks lower-cost on the rate card. Once you fold in the share of raw views that pass watch-time, geo, traffic, and policy gates, the true cost per qualified outcome can be 5-10x the headline number.
Effective CPQV (true cost)
Cost per qualified view after the qualification gate. Folds the legit rate into the math. This is what your CFO actually charged per outcome.
For the deeper background behind this number, read why Qualified Views is the metric that predicts pipeline.
FORKOFF: 80/80 billed = qualified
Raw CPM (rate card)
Headline cost per 1,000 raw views. Counts everything that loaded the player including bots, sub-1-second skips, and out-of-geo plays. The denominator hides the leakage.
Marketplaces: ~25/80 actually qualify
$0.003
FORKOFF CPQV
Contractual, filtered traffic excluded
5-10x
Typical CPQV padding
Marketplace effective CPQV vs FORKOFF
32%
Median legit rate
Audited marketplace samples
5Bn+
Views and growing
Append-only proof

How each calculator mode works.
Budget calc: geo/platform CPV matrix + 8% operational fee fold. CPM converter: effective CPQV = CPM / (1,000 x legit rate), gap = result minus $0.003. Podcast: same budget calc with show-type presets and podcast-specific copy.
Inputs are bounded
CPM is clamped to [$0.50, $30] (the realistic range for short-form clipping marketplaces). Legit rate is clamped to [10%, 100%]. Outside the range, the calculator uses the boundary value.
Effective CPQV is computed
Effective CPQV = CPM ÷ (1,000 × legit rate). Drop the legit rate from 100% to 30% and the effective CPQV triples even though the CPM didn't change.
FORKOFF's CPQV is fixed at $0.003
FORKOFF prices on qualified views directly, so filtered traffic doesn't enter the spend equation. The marketplace number floats with their legit rate; FORKOFF's number is contractual.
Gap = effective CPQV − $0.003
The headline output. A 30% legit rate at $5 CPM = $0.0167 effective CPQV. Gap vs FORKOFF = $0.0137 per qualified view. Multiply by your campaign's qualified-view target to see the leakage in dollars.
Four worked comparisons across operator types.
Same campaign target (1M qualified views). Different operators. The leakage column is what the brand over-pays the marketplace vs paying FORKOFF on a contractual CPQV.
| Scenario | CPM | Legit | QV target | Effective CPQV | Leakage vs FORKOFF | Verdict |
|---|---|---|---|---|---|---|
Whop-style marketplace Self-serve marketplace, brand sources clippers, raw-view priced. | $4.50 | 32% | 1M | $0.0141 | $11,100 | Padded |
Mid-tier KOL agency Flat KOL fee converted to per-view CPM equivalent. | $12.00 | 28% | 1M | $0.0429 | $39,900 | Fictional |
Self-serve clip tool DIY tool subscription, brand pays and sources distribution. | $1.50 | 45% | 1M | $0.0033 | $300 | Defensible |
FORKOFF managed Managed agency. CPQV fixed at $0.003. Filtered traffic excluded. | n/a | 99.71% | 1M | $0.0030 | $0 | Baseline |
Who these calculators are for.
The math applies any time a brand is sourcing distribution from a third party that prices on raw views. Budget calc is for planning. CPM converter is for auditing a quote. Podcast preset is for podcast-led distribution decisions.
Built for
- ·Brands evaluating multiple clipping marketplaces side-by-side.
- ·Finance teams asked to defend marketing spend against audit review.
- ·Podcast brands running founder or network shows who need an audit trail.
- ·Marketing leads negotiating an existing marketplace contract renewal.
- ·Agencies that bill clients on outcomes but source distribution on CPM.
- ·Anyone who received an unusually good CPM quote that needs sanity-checking.
Not the right fit
- ·Tool subscriptions (OpusClip, Vizard, Klap) - see /vs-opusclip for that comparison.
- ·Branded-content deals priced per post (use a flat KOL fee comparison).
- ·TV, OOH, or podcast host-read media (different denominator entirely).
- ·Performance ads priced on click or signup, not view.
- ·Solo creators clipping their own audio library (use Riverside, OpusClip, Munch).
What is a bad CPM?
A bad CPM is one that looks cheap on the rate card but costs more per qualified view once you divide by the share of views that actually qualify. Using this page's own formula, effective CPQV = CPM / (1,000 x legit rate), a $4.50 CPM at a 32% legit rate works out to $0.0141 per qualified view, almost five times the $0.003 FORKOFF bills.
The break-even is simple: at a 32% legit rate, any CPM above roughly $0.96 costs more per qualified view than $0.003. Low-quality raw-view campaigns run $0.50 to $1.50 per 1,000 raw views and mid-market managed campaigns run $4 to $8, so only the bottom of the raw-view band comes in under that line. Paste yours into the CPM converter mode above to see the gap.
Source: FORKOFF, 2026 clipping CPM benchmarks; legit-rate median from the scenarios table above.
What's the difference between CPM, CPC, CPA, and CPQV?
They price the same campaign at different points in the funnel. CPM is cost per 1,000 impressions or raw views, CPC is cost per click, CPA is cost per acquisition such as a signup or purchase, and CPQV is cost per qualified view: a view that passed watch-time, geo, traffic, and policy checks before anyone is billed for it.
- CPM is easy to compare and easy to pad, because bots and sub-second skips still count.
- CPC fits search and paid social, where the goal is a site visit rather than attention on the clip itself.
- CPA fits performance ads with a tracked conversion, and rarely applies to organic short-form distribution.
- CPQV sits between CPM and CPA: it pays for attention that is real, without needing a click to prove it.
Related calculators
The CPQV calculator answers what a clipping campaign costs per qualified view. These free FORKOFF tools answer the questions that usually come next: whether an existing quote is padded, what a creator or KOL post should cost, how many views a launch can expect, and what return the spend needs to clear before it is worth running.
CPQV calculator FAQ
What is a qualified view?
A view that passes four checks set by the campaign brief: watch duration, policy compliance, geo consistency, and traffic validity. If any check rejects it, the view is logged with a reason code and excluded from both spend and payout.
How is qualified-view cost different from CPM?
CPM is cost per 1,000 raw views, regardless of whether anyone watched. CPV (CPQV) is cost per qualified view: only views passing watch-time, policy, geo, and traffic checks count. The denominators are different by 2-3 orders of magnitude.
Why does CPV change with geo and platform?
Advertiser demand differs across markets. US and EU watch is priced higher than SEA. Long-form YouTube has higher CPV than vertical shorts because completion rates and audience intent differ.
Is the operational fee separate?
No, it's folded in. The estimate already subtracts the 8% operational fee from the budget so the qualified-view total reflects what actually reaches clipper distribution. For larger retainers, the fee can be negotiated down.
What happens if my campaign underperforms the estimate?
Sandbox-tier brands get unspent budget refunded if the qualified-view floor isn't hit. Retainer engagements are governed by the contract: typically a make-good plus reset on the qualification rule.
Can I run my existing brand assets through this estimate?
The calculator estimates a fresh campaign. If you're running existing assets through clippers, expect 10-20% higher qualification rate (assets are vetted) and faster time-to-live.
How are the time-to-live numbers derived?
Median across the FORKOFF ledger: single-geo + 1-2 platforms typically goes live in 24-36h. Multi-geo or full-platform spreads take 36-48h because clipper routing fills more pools.
Is the data updated in real time?
The cpvBase numbers update quarterly from ledger averages. The model itself runs on the latest figures every page load.
What's the smallest campaign I can run?
A $1,000 sandbox for 14 days is the smallest campaign. Below that, the qualification engine doesn't have enough volume to reliably hit calibrated CPV. We recommend the sandbox as the first commit before scaling.
What's the largest single-campaign budget you've run?
Six-figure multi-campaign programs are standard. Single-campaign spends above $250K run with split-tested geo cohorts and contracted CPQV floors. Talk to a strategist for those.
Can I get the estimate emailed to me?
Yes. Submit the calculator form with an email and you receive a branded HTML breakdown including the inputs, the headline outputs, scenario comparisons, and a strategist follow-up window. The crew also gets a Slack notification.
Does the calculator account for sanctioned-geo exclusions?
Yes. If you select a geo and our brief acceptance rules exclude part of it, the estimate accounts for the exclusion before showing qualified views. A strategist confirms the exact exclusion list at brief lock.
What if I want to compare CPV vs CPM head-to-head?
Switch to the compare mode of the consolidated calculator at /tools/cpqv-calculator?mode=compare. Same geo/platform/budget inputs, both denominators side-by-side with the same campaign assumptions.
How does the calculator handle multi-platform campaigns?
It rolls up the (geo × platform) cells into a weighted average where the weight is the typical traffic share of each cell. The result reflects the blended CPV your campaign would actually see, not a per-cell median.
Does choosing more platforms always reduce time-to-live?
Counter-intuitively, no. Adding platforms widens the routing pool but also slows the first-clip-live ship time because more clippers are queued. The sweet spot is 2-3 platforms for under 36h, 4+ for 36-48h.
Are there platforms the calculator doesn't model?
Twitch and Discord are not in the model. They require custom retainer engagements. The calculator covers TikTok, YouTube Shorts, Instagram Reels, and X / Twitter. Together they cover the four platforms that account for ~95% of FORKOFF volume.
How do I know the ledger numbers are real?
The published 99.71% legitimacy rate, 5B+ qualified views, and per-view reason codes all come from the same append-only export brand-side legal teams use for treasury and listing-partner review. Available on request via a strategist call.
What does this calculator NOT do?
It doesn't account for creative quality (some brands get better assets so qualify higher), it doesn't predict conversion (qualified view is a watch metric, not a click or signup), and it doesn't price in retainer-tier discounts (those happen in the contract, not the model).
Where does the legit-rate assumption come from?
Industry research and competitor disclosures. Marketplace clipping typically runs 25-45% legit. FORKOFF runs 99.71% on its ledger because filtered traffic is excluded by design at the qualification gate, not after the fact.
Is 99.71% an upper bound?
It is the rolling ledger average across 5B+ qualified views. Specific campaigns range 99.4-99.9% depending on the brief. The qualification engine writes a reason code on every filtered view, so the rate is auditable.
Does this comparison apply to all clipping operators?
Yes for any operator that prices on raw view counts. DIY tools like OpusClip, Vizard, Klap do not fit because they are tool subscriptions, not view-priced. See /vs-opusclip for that comparison axis.
What if my marketplace claims 80%+ legit?
Test it. Run the campaign, sample 1,000 random views with a third-party verification tool, count how many pass watch-time, geo, and traffic checks. Most claimed legit rates collapse under audit.
How is this different from MRC viewability?
MRC viewability checks whether the ad rendered on screen for at least 1 second with at least 50% pixels visible. FORKOFF qualified views check viewability AND watch-duration AND geo AND traffic validity. Stricter denominator.
Can I run this against multiple competitors at once?
Yes. The calculator takes any marketplace's CPM + an estimated legit rate. Run it 3-5 times across competitors, write down the effective CPQV each one produces, and you have a denominator-honest shortlist.
What does a 'true CPQV' tell me my CFO should care about?
Two things: how much you actually paid per qualified outcome, and how much of your raw spend was filtered into rejection. The second number is the leakage your marketplace pricing was hiding.
Why does FORKOFF publish this calculator at all?
Because honest CPQV math is the easiest way to see why managed clipping prices on outcomes, not impressions. The math is the wedge; the calculator just shows it.
How much does podcast clipping cost?
FORKOFF prices podcast clipping per qualified view (CPQV) at $0.003 across most markets. Every campaign is billed only on views that clear the qualification gate, routed to your show's ICP geos, and larger campaigns are scoped per brief at intake. Other operators price on flat retainers ($3,000-$15,000 / month) or raw CPM ($1-$8) where filtered views still count toward billing.
What is the price difference between agency and DIY tools?
DIY tools (OpusClip, Vizard, Munch) cost $20-$80 / month flat. You provide the strategy, brief, clipper roster, qualification, and reporting. Agencies fold all of that in. FORKOFF's CPQV $0.003 means you pay for views that cleared the four-stage gate, not for the tool's monthly subscription regardless of distribution outcome.
How is podcast clipping ROI calculated?
ROI = (qualified views × value per view) ÷ campaign spend. Value per view depends on the show's primary KPI: pipeline (B2B founder pods), wishlist adds (consumer launches), discovery (network shows), or treasury narrative (web3 founder shows). The qualified-view denominator is what makes ROI defensible. raw views inflate the numerator and corrupt the math.
Why does FORKOFF price per qualified view instead of per clip?
Per-clip pricing rewards the clipper for shipping volume. CPQV rewards the clipper for shipping clips that earn watch-through. Brand intent and clipper intent stay aligned on the qualified denominator, not on raw count.
What does the per-view audit ledger include?
Per-view CSV/JSON export with: clip ID, source episode, timestamp, platform, geo, watch-duration band, qualification verdict, reason code on filter, and clipper attribution. Finance reconciles against MMP records (AppsFlyer, Adjust) for consumer-app clients and against treasury reporting for web3 clients.
How fast can a podcast clipping campaign go live?
48 hours for sandbox-tier campaigns. Larger retainers run a separate onboarding window (5-10 business days) covering brand-safety policy lockdown, episode back-catalog audit, and clipper-roster sourcing.
Are there cost-savings from running a back-catalog vs new episodes?
Back-catalog runs are typically 15-25% more cost-efficient at the qualification rate level because the show's narrative beats are already proven. New-episode runs require strategist-led beat selection per drop, which trades higher per-episode cost for fresher topical signal.
How does the qualification rate affect total spend?
Higher qualification rate means more raw views convert to billed views, but billing is capped at the brief budget. So a campaign with 80% legitimacy on $5K spend bills $5K; a campaign with 35% legitimacy on $5K spend also bills $5K because filtered views are excluded. The legitimacy rate affects audit confidence and re-engagement targeting, not the bill amount.
Does FORKOFF charge for filtered or rejected clips?
No. Filtered traffic is logged with a reason code (sub-watch-time, geo-mismatch, sanctioned-region, traffic-validity flagged) and excluded from billing. Brands never pay for traffic that fails any qualification check.
Why is podcast clipping more expensive than direct ads?
It is not. Direct ad CPMs on premium podcast networks run $25-$60. FORKOFF CPQV at $0.003 is roughly $3 effective CPM on qualified views, about 10-20× more cost-efficient per attentive listener. The framing flips when you compare on the qualified-view denominator instead of raw impression CPM.
Per our own CPQV benchmark of 3,085 clips, the qualified-view floor holds at $0.003, and the network has processed 5B+ views to date.
Related FORKOFF surfaces
Authorship
Kshitij JK
Founder, FORKOFF
Last reviewed:
Published:
Methodology
The CPQV calibration data behind this tool comes from FORKOFF's 5Bn+ view proof and growing, normalized against IAB Tech Lab MRC viewability standards and MOAT bot-mix benchmarks. Inputs are anchored on creative-economy clipping data (NoGood, OpusClip, Whop) and weighted by spend-tier to keep small-campaign math honest.
Sources cited
- MRC Viewability Standards , Media Rating Council
- IAB Tech Lab , IAB Tech Lab
- Reddit's creator-economy 2024 report , Reddit Business
Have a question about the CPQV calculator methodology, or need help calibrating against your campaign data? Book a 30-min strategist call
Other free FORKOFF toolsfor your campaign math.
AEO Checker
Four checks in one run: a page's AEO signals, AI crawler access, a mobile Lighthouse audit, and whether ChatGPT, Claude, Gemini, Perplexity and Google AI Overviews name your brand.
Launch Authenticity Checker
Enter a launch post's views and likes, get an Authenticity Grade (A / C / F) from the views-per-like ratio on FORKOFF's RADAR thresholds. Computed live, free.
Launch View-Tier Estimator
Enter follower count and engagement, get your organic view ceiling and which guaranteed tier (1.2M / 3M / 5M) is in reach on FORKOFF's RADAR ~500:1 band. Computed live, free.
Run a sandbox campaign.
14 days. Paid only on qualified views. Audit-ready ledger from day one.
Receipts, deep dives, and playbooks.
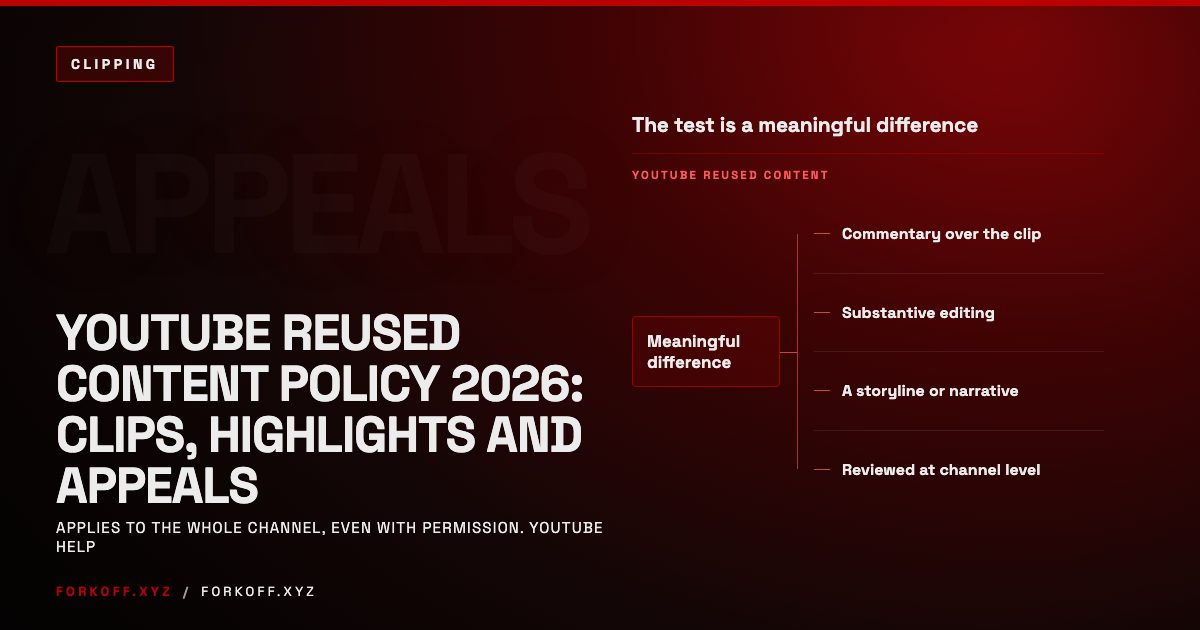
YouTube Reused Content Policy 2026: Clips, Highlights and Appeals
What YouTube's reused content policy actually says, how it treats clips, stream re-uploads and compilations, how to appeal, and how brand clipping stays clean.
 Read
Read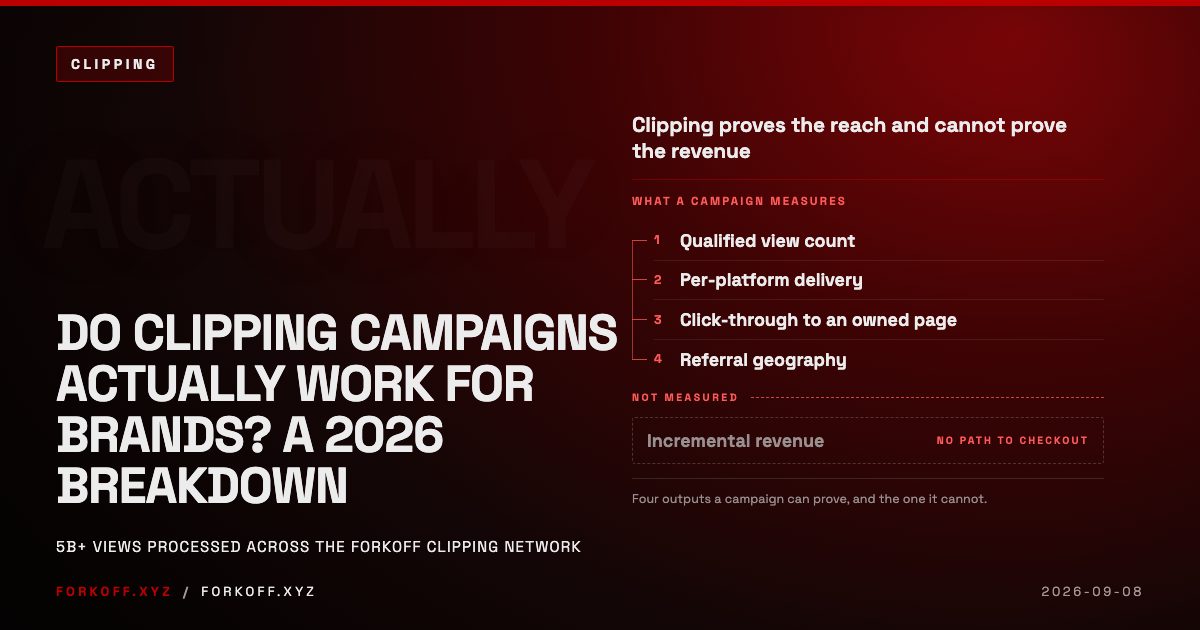
Do Clipping Campaigns Actually Work for Brands? A 2026 Breakdown
Clipping campaigns buy reach at a low unit price and cannot prove revenue. The 2026 breakdown of CPM by content signal, attribution and vendor diligence.
Read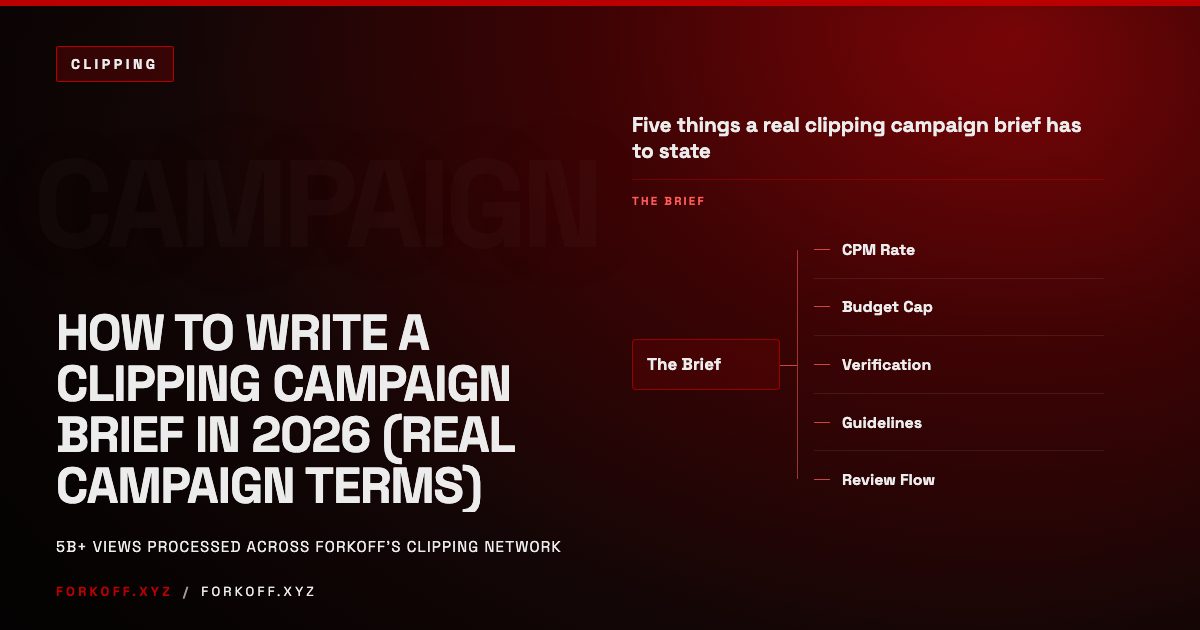
How to Write a Clipping Campaign Brief in 2026 (Real Campaign Terms)
A clipping campaign brief sets the CPM, budget cap, submission rules, and review flow that decide whether a campaign gets quality clips or wasted budget.
Read