
Are those launch views organic, or bought?
Enter the views and likes from any launch post. The tool computes the views-per-like ratio in your browser and returns an Authenticity Grade on FORKOFF's RADAR thresholds: organic below the ~500:1 ceiling, distribution-amplified above it, fraud-tier past ~5,000:1. Free, and nothing leaves the page.
Both numbers come straight off the post. Nothing is sent anywhere: the ratio and the grade are computed in your browser from the two numbers you type. Shorthand like 2M or 450k works.
At or above roughly 5,000 views per like the reach is statistically near-impossible for genuine viral distribution. A ratio this extreme is the signature of bought views.
Treat the number as bought. Do not report it as an organic result, and discount any pitch that leans on it as proof of reach.
Why views per like reads authenticity.
A view is cheap to manufacture. A like is a real person choosing to engage. When reach outruns engagement by an order of magnitude, the extra reach did not come from organic pull, so the ratio between the two is a forensic tell that a raw view count can hide.
Organic ceiling
Around 500 views per like. Genuine viral distribution brings engagement with it, so the ratio stays inside this band. This is what a grade-A launch reads.
For the deeper background behind this number, read the audit of 134 X launches that established the organic-versus-bought signature.
Fraud-tier line
Around 5,000 views per like. A gap this wide between reach and engagement is statistically near-impossible for real distribution, so the reach is almost certainly bought.
~500:1
Organic ceiling
Views per like below which reach reads earned
~5,000:1
Fraud-tier line
Ratio too extreme for genuine viral reach
5B+
Views processed
The FORKOFF distribution ledger behind RADAR
$0
Cost to run
Free, computed live in your browser

How the checker reads a launch.
Two inputs, one ratio, three bands. The same views-forensics RADAR runs on a corpus of real launches, applied to the one you paste.
Read the two numbers off the post
Open the launch post and note the view count and the like count. Those are the only two inputs. Nothing else about the post changes the grade.
Compute the views-per-like ratio
The tool divides views by likes in your browser. A launch with 2,000,000 views and 400 likes is 5,000 views per like; one with 1,000,000 views and 4,000 likes is 250 views per like.
Read the band
The ratio lands in one of three bands on the gauge: organic at or below 500:1 (grade A), distribution-amplified from 500:1 to 5,000:1 (grade C), or fraud-tier at or above 5,000:1 (grade F).
Act on the grade
Grade A: the reach is earned, so amplify it. Grade C: audit where the reach came from before citing the number. Grade F: treat the view count as bought and do not report it as an organic result.
Who this checker is for.
Any time a launch view count is being used as proof, the views-per-like ratio is the cheapest sanity check available before you trust the number.
Built for
- ·Founders sanity-checking their own launch numbers before a fundraising deck.
- ·Investors reading a launch metric in a pitch and wanting to test it in ten seconds.
- ·Marketers auditing an agency's viral case study before signing.
- ·Anyone comparing two launches where one has a suspiciously high view count.
- ·Operators deciding whether a launch is worth amplifying or already inflated.
Not the right fit
- ·Verdicts on a specific person, the ratio is a signal, not an accusation.
- ·Long-form video views where watch-time, not likes, is the engagement axis.
- ·Paid ad campaigns, where amplified reach is expected and disclosed.
- ·Posts with likes hidden, the tool needs both numbers to compute.
Launch Authenticity Checker FAQ
What does the Launch Authenticity Checker measure?
It measures the views-per-like ratio of a single launch post and grades it against FORKOFF's RADAR thresholds. Organic reach tends to top out near 500 views per like, because genuine viral pull brings engagement with it. When the view count runs far ahead of the likes, the extra reach arrived without the engagement organic distribution produces, which is the signature of paid or algorithmic amplification.
How is the Authenticity Grade calculated?
Divide views by likes to get the views-per-like ratio, then read the band. At or below 500:1 the launch grades A and reads organic. Between 500:1 and 5,000:1 it grades C, suspicious and distribution-amplified. At or above 5,000:1 it grades F, a fraud-tier signature that is statistically near-impossible for genuine viral reach. The math runs entirely in your browser from the two numbers you enter, with no data sent anywhere.
Why 500:1 and 5,000:1 as the thresholds?
They come from FORKOFF's RADAR method, the same first-party view-forensics used across a corpus of real X launches. Roughly 500 views per like is the organic ceiling in that data; past it the reach outpaces engagement. Roughly 5,000 views per like is the fraud-tier line, where the gap between reach and engagement is too wide for any genuine distribution to explain. See the Views-to-Likes Benchmark 2026 study for the full derivation.
Is a grade C or F proof that views were bought?
No. The ratio is a signal, not a verdict on a specific post. A grade C means the reach ran ahead of engagement and should be audited before it is cited, which can happen with legitimate paid distribution too. A grade F means the ratio is extreme enough that bought amplification is the most likely explanation. Either way the honest read is to trace where the reach came from before reporting the number as organic.
Does FORKOFF buy views to hit a launch number?
No. FORKOFF audits reach with RADAR and delivers a guaranteed view tier through organic distribution, with a make-good if the tier is missed. The views are never bought. That is why the same views-per-like read the checker runs on any public post is the read FORKOFF holds its own launch work to.
Can I check a launch that is not on X or Twitter?
Yes. The ratio is platform-agnostic: any post that reports a view count and a like count can be graded. The RADAR thresholds were calibrated on X launch data, so they read most precisely there, but the organic-versus-amplified logic holds anywhere reach and engagement are both visible.
Per our own views-to-likes benchmark of 5,375 creators, an engagement ratio outside the observed band is the cheapest tell that a launch was amplified.
Related FORKOFF surfaces
Authorship
Kshitij JK
Founder, FORKOFF
Last reviewed:
Published:
Methodology
The ~500:1 organic ceiling and ~5,000:1 fraud-tier line come from FORKOFF's RADAR view-forensics: a first-party corpus of real X launch videos scored on the views-per-like method. The checker applies those thresholds to the single post you enter, computing the ratio client-side with no data leaving the browser.
Sources cited
- Are X Launches a Scam? We Audited 134 of Them , FORKOFF Research
- Views-to-Likes Benchmark 2026 , FORKOFF Research
- RADAR launch corpus , FORKOFF
Have a question about the Launch Authenticity Checker methodology, or need help calibrating against your campaign data? Book a 30-min strategist call
Other free FORKOFF toolsfor your campaign math.
AEO Checker
Four checks in one run: a page's AEO signals, AI crawler access, a mobile Lighthouse audit, and whether ChatGPT, Claude, Gemini, Perplexity and Google AI Overviews name your brand.
Launch View-Tier Estimator
Enter follower count and engagement, get your organic view ceiling and which guaranteed tier (1.2M / 3M / 5M) is in reach on FORKOFF's RADAR ~500:1 band. Computed live, free.
Marketing ROI Calculator
5-channel deterministic ROI model. Allocate spend across paid, content, KOL, PR, events; see modeled pipeline and the FORKOFF Clipping channel alternative on the same budget.
Run a sandbox campaign.
14 days. Paid only on qualified views. Audit-ready ledger from day one.
Receipts, deep dives, and playbooks.
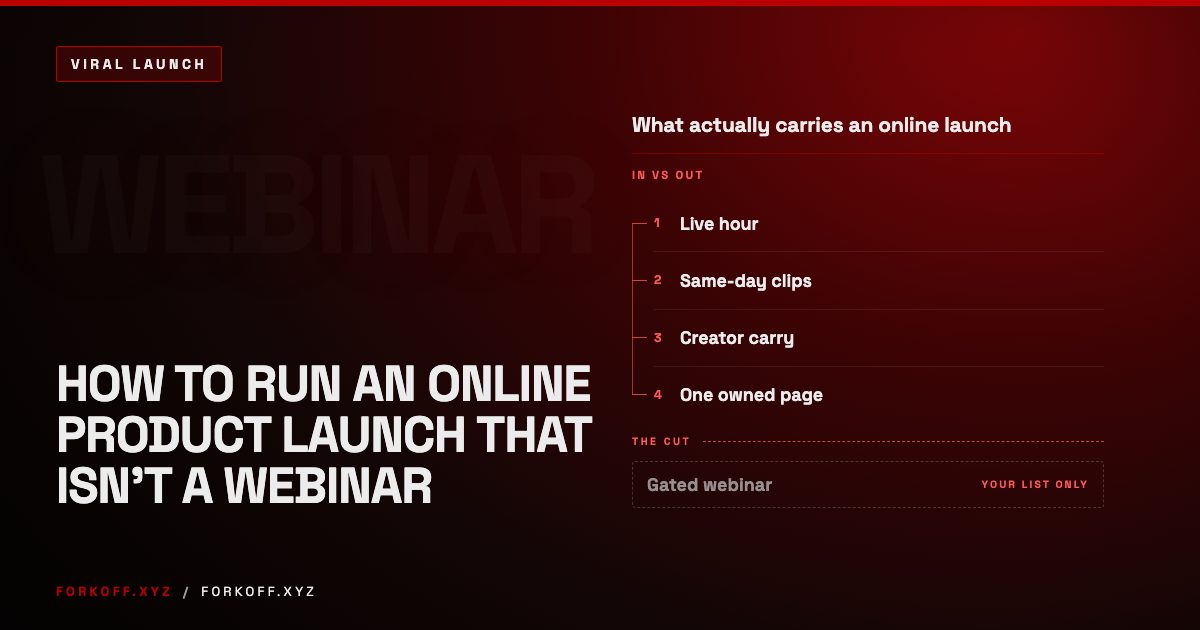
How to Run an Online Product Launch That Isn't a Webinar
An online product launch is a live moment cut into clips that creators carry, not a gated webinar. Here is the livestream, clip and creator stack for 2026.
 Read
Read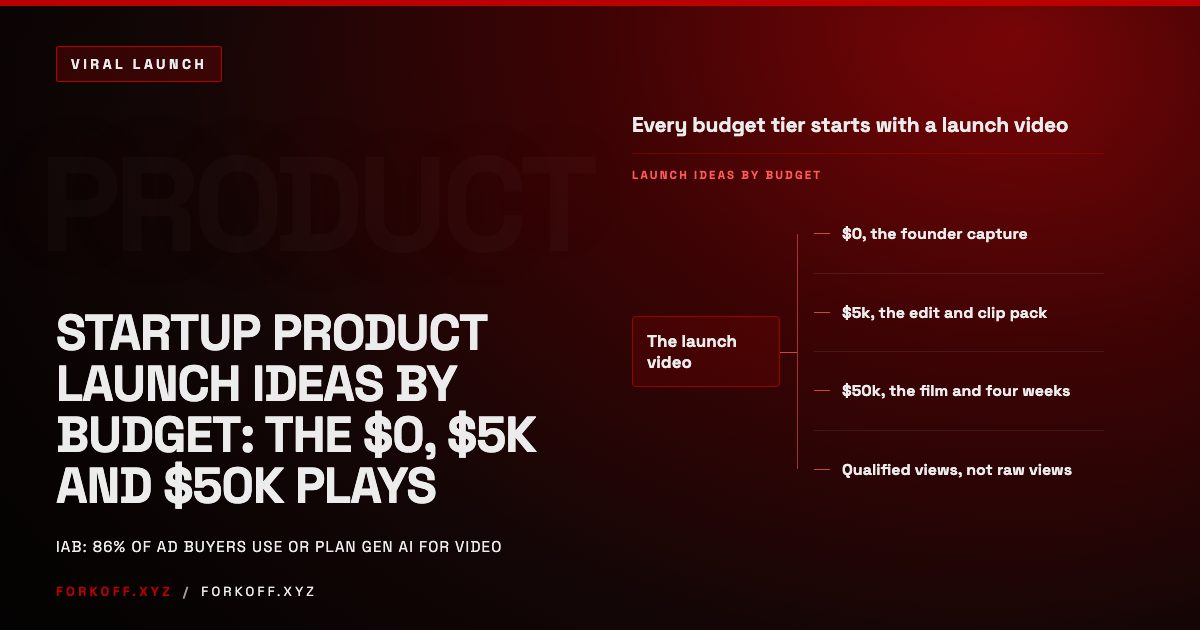
Startup Product Launch Ideas by Budget: The $0, $5k and $50k Plays
Product launch ideas for a SaaS startup sorted by budget: what the launch video should be at $0, $5k and $50k, and the distribution around it.
Read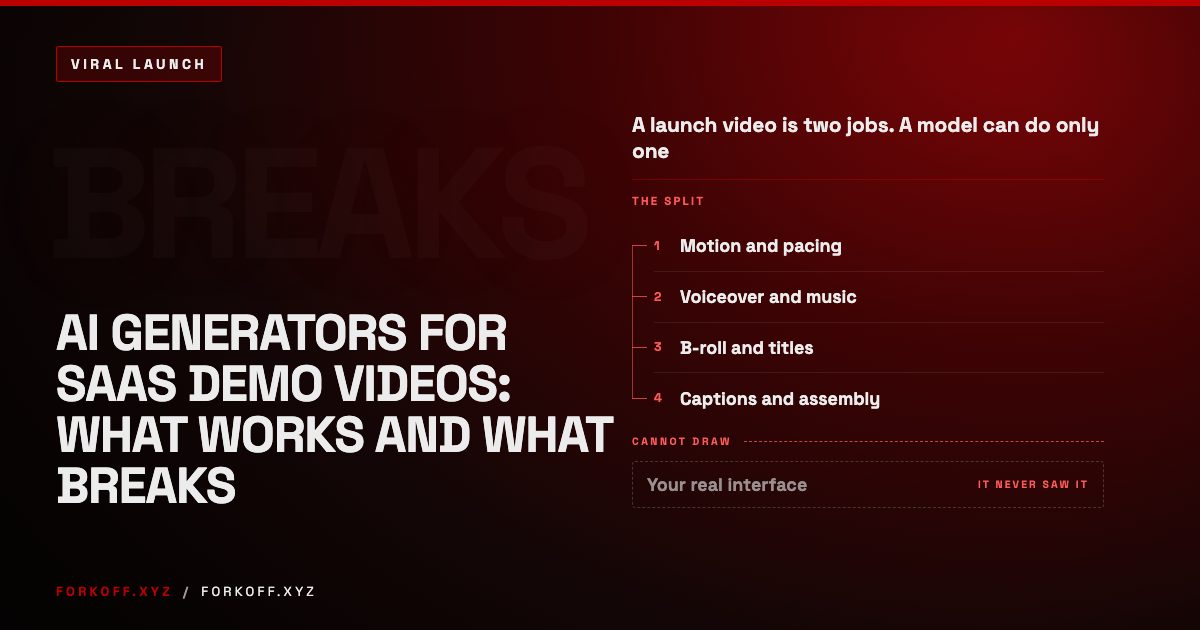
AI Generators for SaaS Demo Videos: What Works and What Breaks
AI video generators handle motion, voiceover and pacing well and draw your interface badly. Which half of a launch video to give a model, which half to keep.
Read