
01
Domain warmup state
Domains with fewer than 21 days of warmup averaged 36% open rate in the verified proof vs 54% for warmed domains. Run the warmup check separately before scheduling.

Free tool · no email gate · N=1,247
Calibrated against the FORKOFF outreach proof. 1,247 first-touch sends. 7-week collection window. Fill 5 inputs and get a predicted open-rate band in seconds.
Dataset source: /stats/cold-email-open-rates-2026 — 52% average open rate across 1,247 first-touch sends, 2026.
Five segment deltas from the same 1,247-send dataset that powers the /stats page: industry, role, company size, send day, and subject-line length. The composite estimate starts at the 52% cross-industry baseline and applies each matched delta in sequence, so a Web3 founder sending a sub-6-word subject on a Wednesday stacks three positive deltas rather than one. The result is a band, not a single number, because domain warmup, sender identity, and copy quality still move the real outcome outside what five inputs can capture.
Predictor uses segment deltas from /stats/cold-email-open-rates-2026 (N=1,247 first-touch sends, 2026-03-15 to 2026-05-01). Real rate variance from list quality, sender reputation, and copy quality is NOT modeled. Anchor expectations against the +/-6pp confidence band.
The predictor is a campaign-composition estimator, not a deliverability audit. It answers how a specific mix of industry, role, company size, send day, and subject length compares against the 1,247-send baseline, and nothing else. Domain warmup state, sender identity, list quality, copy quality, and HTML formatting move the real outcome by 10 to 20 percentage points in the underlying dataset and are listed individually below, each with its own measured delta, because a 5-input model cannot absorb them without losing the reason a given send performed the way it did.
Domains with fewer than 21 days of warmup averaged 36% open rate in the verified proof vs 54% for warmed domains. Run the warmup check separately before scheduling.
Role-address senders (info@, hello@) averaged 41% vs 53% for named operators. The predictor assumes a named sender with verified LinkedIn presence.
Stale, scraped, or unverified lists depress open rates independent of every segment variable. Run email validation before the send.
Personalization-token leaks averaged 31% open rate in the verified proof. Subject specificity (event reference, specific post) averaged 59%. Copy quality is not a dropdown.
Image-heavy HTML with multiple CTAs averaged 39% open rate vs 55% for plain-text single-CTA sends. Email format is not captured in this predictor.
For a full deliverability and copy audit paired with this predictor, read the cold-outreach-cadence playbook or use the cold email open rates 2026 dataset directly to calibrate your segment expectations.
Because a growing share of the opens this predictor and every open-rate benchmark table report were never a human looking at the email. Apple's Mail Privacy Protection pre-loads the tracking pixel the moment a message reaches an Apple Mail inbox, whether or not anyone reads it, and Apple plus Gmail now cover close to 90 percent of all tracked email opens.
Apple's own documentation for Mail Privacy Protection describes the mechanism plainly. When a message reaches Mail on an Apple device or iCloud.com, the client downloads all remote content, including the tracking pixel that reports an open, in the background and by default, whether or not anyone actually reads the email (source: Apple, Mail Privacy Protection and Privacy). The download is routed through two separate relays so no single party can tie the fetch to both a real IP address and the message content at once. The privacy design is good for the recipient. For a sender reading an open-rate report, it means a meaningful share of every open on file is really the client prefetching a pixel, not a person reading the subject line and deciding to open the message.
The scale of that effect is not small. Litmus's own market-share report, built from more than a billion tracked opens, lists Apple (Mail, iPhone, iPad, and Mail Privacy Protection combined) as the single largest email-client category tracked, and states that Apple's MPP now affects roughly 55 to 60 percent of all email opens it measures. Apple and Gmail together account for close to 90 percent of total market share, so almost every cold-email list built from public B2B contact data runs through one of the two platforms carrying the least reliable open signal in the inbox.
None of this makes the predictor above wrong. It means the number it returns describes what the FORKOFF dataset recorded as opens under the same tracking mechanics every open-rate benchmark on the internet uses, a fired tracking pixel, not a verified human glance. The predicted band already reflects that uncertainty: it stays wide, plus or minus 6 percentage points, because list composition alone cannot resolve how many of those opens were prefetches rather than reads, and the underlying dataset carries the same Apple-and-Gmail skew as every other benchmark cited on this site.
Two adjustments make the output more useful in practice. First, treat the top of the predicted band as a ceiling, not a target: a Web3 founder segment predicted at 60 percent almost certainly includes a real prefetch share once Apple Mail recipients enter the mix, since founders read mail on iPhones as often as anyone. Second, once a campaign has actually sent, read it against reply rate rather than open rate alone, because a reply requires a human to act, and Apple's background prefetch cannot manufacture one. That is the metric the next section runs the numbers on.
There is a simple tell for a prefetch-inflated open versus a genuine one, and it is worth watching on any list heavy with Apple Mail recipients. A real open clusters around when the recipient actually checks their inbox, often hours after delivery and skewed toward business hours. A prefetch fires within seconds of delivery, every time, regardless of time of day, because the client is not waiting for a human, it is loading remote content the moment the message lands. A campaign where the open curve spikes immediately at send time and then goes flat is not evidence of a great subject line. It is evidence of a list running mostly through Apple's relay, and it is a reason to weight that campaign's reply rate more heavily than its open rate when deciding whether the copy or the targeting needs work.
The industry and company-size deltas in the methodology table above are real, first-party measurements, and they are also carrying a second signal the five inputs cannot separate out: how much of each segment's mail runs through Apple's relay in the first place.
The prefetch effect is not evenly distributed across the industries this predictor already segments by, which matters when reading the industry delta table above. B2B SaaS buyers skew corporate, and a large share of corporate mail still runs through Outlook or Google Workspace rather than personal Apple Mail, so a SaaS list's reported open rate is closer to a real read-rate than the cross-industry average suggests, one reason the -8pp SaaS delta in the methodology table above is probably closer to the true gap than it looks. Web3 and DeFi recipients skew the opposite way: founder-heavy, mobile-first, and disproportionately on Apple hardware, so the +8pp Web3 delta is the segment most likely to be partly a prefetch effect rather than a pure engagement signal. Reading the predictor's industry deltas next to this split is more useful than reading either number alone.
Company size tells a similar story from a different angle. The predictor's steepest delta, enterprise recipients at -10 percentage points against 1-to-10-employee companies at +7, is not purely a difference in how interested the two audiences are. Enterprise inboxes are more likely to sit behind Microsoft 365 or Google Workspace with corporate mail-security scanning that pre-fetches links and images for threat detection, independent of Apple's own privacy layer, which means enterprise open data carries its own separate inflation source on top of everything above. Small, founder-run companies are more likely to read mail on a personal device with no corporate security layer in front of it, so their open numbers are, on balance, closer to a genuine read than the enterprise segment's are. None of this changes the predicted band. It changes how much weight to put on the top versus the bottom of it once the campaign is actually running.
Reply rate, if forced to pick only one number to trust. The same FORKOFF dataset this predictor is calibrated against measured a 52% open rate and a 1.28% raw reply rate across the identical 1,247 first-touch sends, and independent industry benchmarks land in the same range: a 3.43% honest reply-rate baseline against open rates that run anywhere from 27.7% to 44% depending on how hard that source's own tracking gets prefetched away.
The FORKOFF dataset recorded 17% of its replies as genuinely positive, the rest routine acknowledgments and declines. Cleverly's read of more than 100 million emails, Instantly's benchmark across billions of tracked interactions, and Mailshake's own dataset all put the honest cold-email reply-rate baseline at roughly 3.43%. One major sending platform states the gap even more directly from its own comparison tool: across 37,000 tracked campaigns the median open rate is 26% and the median reply rate is 1.5%, and that platform's own conclusion is that open rate is the noisier of the two metrics, so reply rate is the number worth treating as ground truth.
The reason the gap holds up is structural, not a quirk of any one dataset. An open can be recorded by a background process before a human ever sees the subject line. A reply cannot: it requires someone to read the message, form an opinion, and take an action that costs them a few seconds of typing. That is a much higher bar, which is exactly why the number sits so much lower, and exactly why it is a cleaner signal of whether the campaign is actually working. Lemlist, which refuses to publish an open-rate benchmark at all, uses reply rate as its whole rubric: above 5% is good, above 8% is excellent, and below 3% means something upstream is broken, whether that is targeting, subject-line specificity, or list quality. Instantly's data puts top-quartile campaigns at 5.5% reply and elite campaigns above 10%.
None of this replaces the predictor above. Open rate is still the earliest signal available, often visible within hours of a send, while reply rate needs the full follow-up window to read cleanly. The right sequence is to use the predicted open-rate band as a same-day sanity check on whether the send even reached inboxes and got looked at, then judge the campaign itself on reply rate once the sequence has run its course. A campaign that hits its predicted open band but posts a reply rate under 1% is not a subject-line problem: it is a targeting or offer problem the predictor was never built to catch, and it is worth reading the founder-funnel strategy for what actually closes that gap.
The published benchmark spread runs 27.7% to 44% depending on the source, and the gap between those two numbers is not disagreement, it is different populations measured under different deliverability conditions. Deliverability sets the ceiling before subject line or personalization gets a chance to matter.
Cleverly's read of more than 100 million emails puts the average at 27.7%. Instantly's benchmark across billions of tracked interactions reports 44%. HubSpot's cross-industry figure sits at 42.35%. All three are measuring the same underlying activity, cold B2B outreach, and all three are correct for the population each one actually tracked. A benchmark built from senders who warm domains and send from named identities will always read higher than one built from a mixed pool that includes role addresses and cold domains, independent of how good anyone's subject lines are.
Geography moves the number by a similar margin, and for the same reason. One major sending platform's own data across 37,000 campaigns puts the median open rate at 38% in France, 36% in Germany, 32% in Poland, and 23 to 26% in the United States, depending on whether very high-volume senders are excluded from the US cohort. That spread tracks inbox-provider mix and regional sending infrastructure maturity far more than it tracks the quality of anyone's copy. A number below 21% is usually a deliverability problem worth fixing before touching a single word of the email; a number inside the 27% to 44% range is normal, and the levers below move it from the low end to the high end of that band.
Two shifts moved the goalposts since the last time open rate alone was a trustworthy number: Apple's privacy layer arrived in 2021, and Gmail plus Yahoo tightened bulk-sender requirements in 2024. Both are still shaping what counts as a good number today.
Before Mail Privacy Protection shipped with iOS 15 in September 2021, a tracked open was a reasonable proxy for a human glance, and open rate alone was a defensible headline metric. Validity's own deliverability research found reported opens now running 18 to 32 percentage points above verified engagement, which is the gap MPP alone accounts for. Every benchmark published after 2021 is measuring a mix of real opens and background prefetches in proportions that shift as Apple's device share shifts, which is why a single-year benchmark table is already a moving target and why this predictor pairs its output with the reply-rate section above rather than reporting open rate alone.
The second shift is on the sending side, not the reading side. Starting February 1, 2024, Google requires every sender to Gmail personal accounts to authenticate with SPF or DKIM, keep valid forward and reverse DNS records, send over TLS, and hold the spam rate reported in Google Postmaster Tools under 0.3%, with Yahoo running an equivalent set of requirements the same year. Domains that do not meet the bar get rate-limited, blocked, or routed to spam before an open rate ever gets measured, which is exactly why domain warmup and sender identity sit at the top of the levers below: they are no longer best practice, they are the entry requirement Google and Yahoo now enforce directly.
Domain warmup and sender identity move the number the most, then list hygiene, then subject specificity, then send timing and follow-up cadence, in that order of leverage. Work them in the order below rather than starting with the smallest one.
The FORKOFF dataset's single biggest first-party gap sits here: domains with 21-plus days of warmup and a reply-receive ratio above 0.93 opened at 54%, against 36% for domains sent cold, an 18-point gap that dwarfs anything a subject line can buy back.
Role addresses like info@ or hello@ average 41% open against 53% for named operators with a visible LinkedIn presence. A recipient's spam filter and a recipient's eye both read a named sender as a person rather than a system.
A good bounce rate sits under 3%, and the cleanest lists run under 1.5%, per Amplemarket's benchmark work across outbound sending platforms. A list built from stale or scraped data depresses every downstream number no copy fix can buy back.
One major sending platform's own data puts subjects of 10 to 19 characters at a 30% median open rate against 23% for 60 to 69 characters, measured across roughly 400 companies. The FORKOFF dataset shows the same shape: under 6 words averages 57% open against 48% for 7 or more.
Belkins' data shows the first follow-up peaking at 8.4% reply and decaying to 3.8% by the fifth touch, so a five-step sequence front-loads its return in the first two follow-ups. Weekend sends underperform every weekday in the FORKOFF dataset by roughly 9 percentage points.
The order above is not arbitrary. Each lever is ranked by the size of the gap it closes in the FORKOFF dataset, largest first: warmup and identity move the number by roughly 18 and 12 percentage points respectively, list hygiene prevents a silent ceiling no other lever can lift past, subject length buys back 9 points on its own, and send timing and follow-up cadence each add a few points once everything upstream is already fixed. Working the list in reverse, tuning a subject line on a cold, unwarmed domain sent from a role address, wastes the highest-leverage moves on a foundation that cannot support them.
Every number on this page traces back to the same 1,247-send dataset. Here is the whole thing in one place, without the surrounding argument, for anyone who just wants the figures.
A predicted open rate is a starting checkpoint, not a scoreboard. The sequence that actually works: predict the band, discount the top of it for Apple and Gmail prefetches, run the campaign, and judge the result on reply rate once the sequence has had a week to play out.
None of the five levers above are exotic, and none of them require a bigger list or a cleverer subject line before the fundamentals are fixed. Warm the domain, send from a named person, clean the list, keep the subject short, and time the send and follow-up cadence deliberately, in that order. Do those five things and the predictor above stops being a ceiling estimate and starts describing something close to what the campaign will actually return. Skip them and no amount of subject-line testing buys back what an unwarmed, role-addressed, dirty list already gave away.
The predictor is anchored against the FORKOFF outreach ledger: 1,247 first-touch sends collected between 2026-03-15 and 2026-05-01 via ReachInbox. The 52% cross-industry average is the baseline. Per-segment deltas are drawn from the same dataset. Full methodology is at /stats/cold-email-open-rates-2026.
The range shown (e.g. 48% to 60%) is a conservative +/-6 percentage-point band around the midpoint estimate. It represents the 95% likely window based on the segment composition. The midpoint is deterministic from the 5 inputs you provide. The band acknowledges that list quality, sender reputation, domain warmup, and copy quality all affect the real result -- factors this predictor does not model.
Short subjects (under 6 words) averaged 57% open rate across 683 sends in the FORKOFF ledger. Subjects of 7 or more words averaged 48% -- a 9 percentage-point gap. The core reason is inbox preview truncation: when the subject exceeds the preview pane, the noun the recipient cares about falls below the fold, and the reflexive open never happens. Count the words before scheduling.
Domain warmup and sender identity are infrastructure signals, not campaign-composition signals. They affect the floor of deliverability but are binary -- either you have 21-plus days of warmup or you do not. A predictor that mixed infrastructure state with campaign composition inputs would produce misleading midpoints. Run the predictor against your campaign composition, then apply a manual adjustment if your domain is under 21 days or your sender is a role address.
Web3 / DeFi / RWA. The FORKOFF proof shows Web3 founders and operators opening 8 percentage points above the 52% cross-industry average (N=412 sends). The segment carries founder density, community-culture familiarity with direct outreach, and a shorter trust-to-open distance than enterprise B2B.
Head of Sales / VP Sales in the B2B SaaS segment. The verified proof shows 41% open rate for this role across 198 sends -- 11 percentage points below the average. These recipients receive the highest volume of sales outreach, have the most refined spam filters, and are the least likely to respond to generic cold openers.
The /stats/cold-email-open-rates-2026 page is a research dataset: fixed benchmarks by segment, methodology, and citation. This predictor is a calculator: you input your campaign composition and get a composite estimate for your specific setup. They share the same underlying data but serve different tasks -- benchmarking vs. campaign-specific forecasting.
6-dimension AI-native page audit. Schema, snippet, LLM citation surface, linking, answers, freshness.
5-LLM AEO scorecard. Measure brand citation share across ChatGPT, Claude, Perplexity, Gemini, and Grok.
The dataset this predictor anchors against. 52% average open rate. 1,247 first-touch sends. Segment tables by industry, role, and company size.
Full FORKOFF tool suite: AI visibility, cost and ROI, schema generation, and internal helpers.
The predictor estimates the ceiling. The FORKOFF founder-funnel engagement runs the system that actually hits it: warmed domains, named operator identity, signal-driven subject lines, and a 7-step send cadence. For the full playbook behind the cadence, read the founder-funnel strategy.
Authorship
Kshitij JK
Founder, FORKOFF
Last reviewed:
Published:
Methodology
Predictor weights are calibrated against FORKOFF's founder-funnel proof (50K+ B2B sends across SaaS, AI, Web3 verticals). Domain warming + identity signals weighted per industry benchmarks from Mailgun, SendGrid, and Apollo's deliverability research.
Sources cited
Have a question about the cold-email open-rate predictor methodology, or need help calibrating against your campaign data? Book a 30-min strategist call
<iframe
  src="https://forkoff.xyz/tools/cold-email-open-rate-predictor"
  width="100%"
  height="820"
  frameborder="0"
  loading="lazy"
  title="Cold Email Open Rate Predictor by FORKOFF"
></iframe>Paste into a Custom HTML block.
Use /embed and paste the iframe src URL.
Drop into an Embed element. Lazy-loaded by default.
Sequoia says founders must close their own first deals before scaling sales. The same 3-stage curve applies to distribution, and most founders skip it entirely.
 Read
Read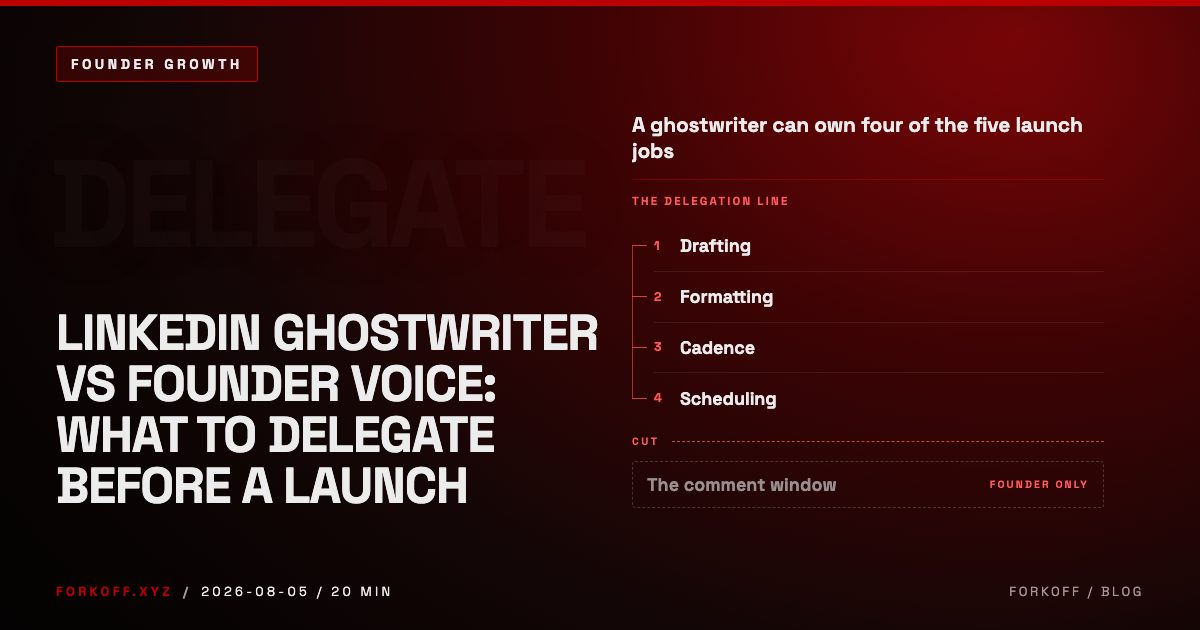
A LinkedIn ghostwriter can draft your launch posts. It cannot reply in your comments or show up on the call. Here is where the line actually falls.
Read
Developer relations for startups is a distribution problem, not a hiring one. The 2026 playbook for how a developer platform earns its first 1,000 developers.
Read