
What does an organic vs amplified launch look like?
Updated Jul 1, 2026
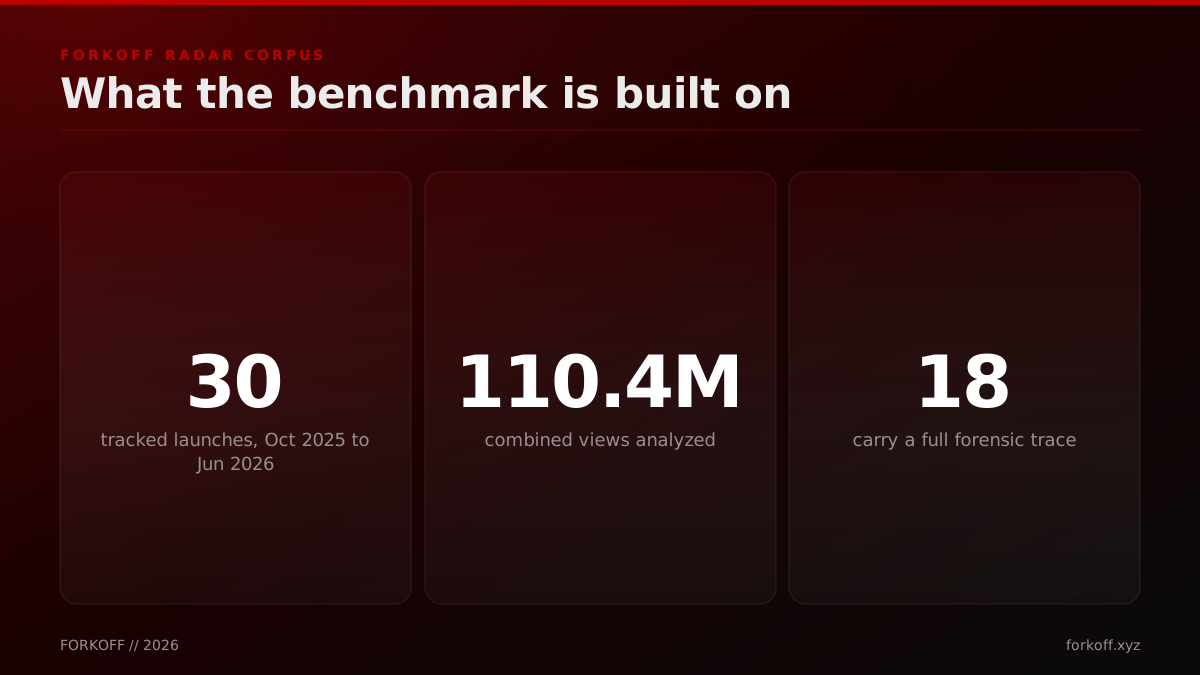
An organic launch and an amplified one look different in the numbers. Across RADAR's corpus of 30 tracked launches, about 110.4 million combined views from Oct 2025 to Jun 2026, organic reach holds near or below 500 views per like, while amplified reach climbs into the thousands. RADAR, FORKOFF's launch-intelligence surface, reads the gap as a distribution-amplified signature, using aggregate bands and naming no single launch.
Per our own views-to-likes benchmark of 5,375 creators, an engagement ratio outside the observed band is the cheapest tell that a launch was amplified. FORKOFF Views-to-Likes Benchmark 2026
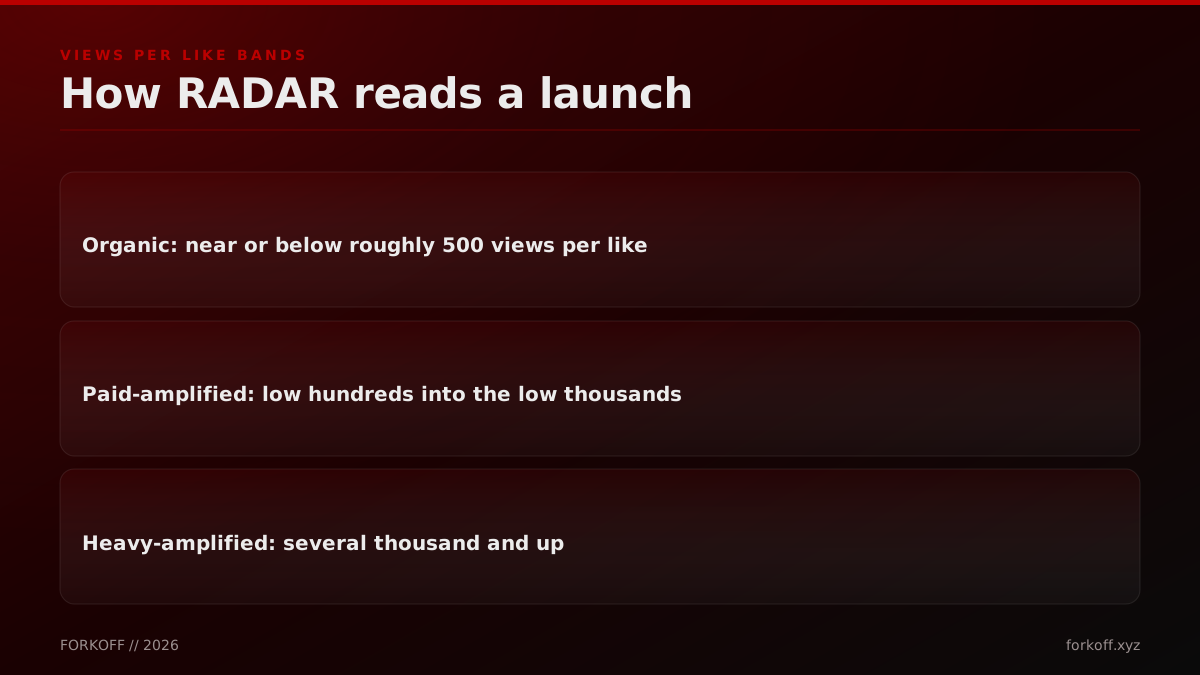
- 01The organic band Near or below roughly 500 views per like. Across RADAR's 30 tracked launches 10 read as organic, where likes and replies keep pace with views and no amplification signature appears.
- 02The paid-amplified band From the low hundreds into the low thousands of views per like. Most tracked launches land here, where reach ran past the organic ceiling and a launch-hour quote-tweet burst shows the reach was coordinated.
- 03The heavy-amplified band Several thousand views per like and up. The far end of the set, where views climbed into the millions while likes stayed in the hundreds, so almost no engagement arrived behind the reach.
- 04Verified vs reconstructed 18 of the 30 launches carry a full forensic trace and read as verified. The rest are reconstructed from the ratio alone, labeled lower confidence, and never turned into a hard call.
- 05Aggregate and anonymized The benchmark reports bands across the whole set. It never names a single launch as botted, because a fair benchmark describes the distribution, not any one founder.
What the spread actually shows
Read together, RADAR's corpus of 30 launches, about 110.4 million combined views from Oct 2025 to Jun 2026, shows organic reach is the exception, not the rule, among launches large enough to track. Only 10 of the 30 read as organic; the other 20 carry a paid or amplified signature, most in the paid-amplified range and a few far higher, where views ran into the millions while likes stayed in the hundreds. The point is not that amplification is wrong, it is legal and common, but that a headline view count on its own tells a buyer almost nothing about how many real people the launch reached.
Why the benchmark names no launch
A benchmark works because it is aggregate. Reporting the bands, how many launches fall in each views-to-likes range, tells a buyer what normal and abnormal look like without pinning a label on any named founder. That restraint is deliberate and load-bearing here, because the underlying data names real, public launches. Distribution-amplified is a description of how reach was assembled, not an accusation, and a launch with only a partial record stays a lower-confidence reconstruction. The per-launch readings live on the RADAR hub, each tied to its public source post, so anyone can audit a single reading without the benchmark ever singling one out.
The views-per-like bands across RADAR's corpus
| Band | Views per like | Where launches land | What the engagement shows |
|---|---|---|---|
| Organic | Near or below roughly 500 | 10 of 30 read as organic | Likes and replies keep pace with views |
| Paid-amplified | Low hundreds into the low thousands | Most tracked launches | Reach past the ceiling, plus a launch-hour quote-tweet burst |
| Heavy-amplified | Several thousand and up | The far end of the set | Views into the millions while likes stayed in the hundreds |
Across RADAR's 30 tracked launches (about 110.4 million combined views, Oct 2025 to Jun 2026), 18 carry a full forensic trace and read as verified; the rest are reconstructed from the ratio alone. Bands are aggregate, no single launch is named.
Frequently asked questions
What does an organic launch look like in the numbers?
Its views-to-likes ratio holds near or below roughly 500, with likes, replies, and quote-tweets keeping pace with views. Across RADAR's 30 tracked launches 10 read as organic, which makes genuine viral reach rarer than headline numbers suggest.
What is a typical amplified launch ratio?
Most tracked launches land in the paid-amplified band, from the low hundreds into the low thousands of views per like, with a synchronized quote-tweet burst in the launch hour. Reach ran past the organic ceiling, so the extra views arrived without matching engagement.
How large is the RADAR dataset?
It covers 30 tracked launches and about 110.4 million combined views, from Oct 2025 to Jun 2026. 18 of the 30 carry a full forensic trace and read as verified, while the rest are reconstructed from the ratio and labeled lower confidence.
Does the benchmark name which launches were botted?
No. It reports aggregate bands and never labels a single launch as botted. The distribution is what makes a benchmark useful, and singling out a named founder is exactly what RADAR's defamation-safe method is built to avoid.
Why are most launches not organic?
Because coordinated distribution is now standard practice at launch, and it is legal. The benchmark shows most large launches buy or coordinate reach past the organic ceiling, which is why a raw view count needs the engagement behind it to mean anything.
Receipts, deep dives, and playbooks.
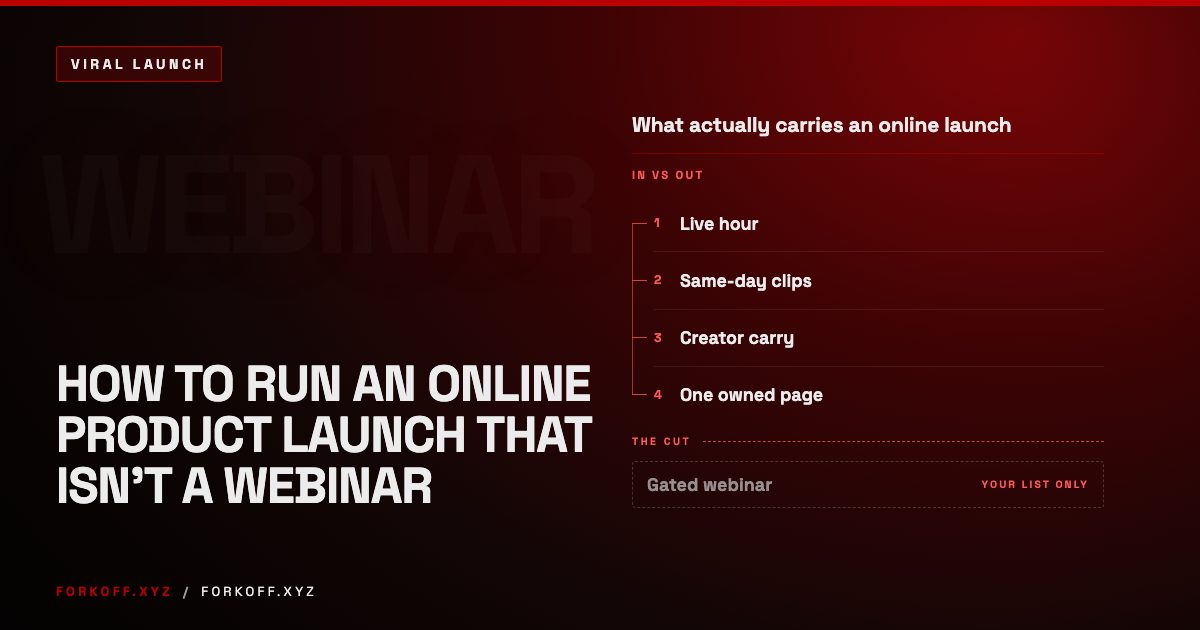
How to Run an Online Product Launch That Isn't a Webinar
An online product launch is a live moment cut into clips that creators carry, not a gated webinar. Here is the livestream, clip and creator stack for 2026.
 Read
Read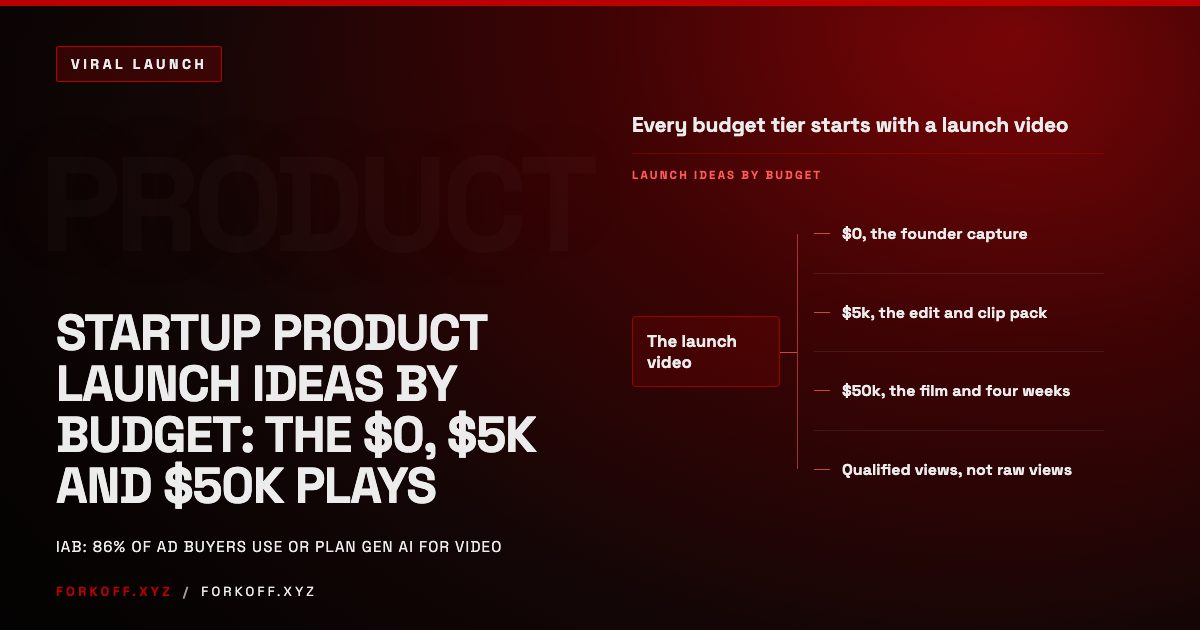
Startup Product Launch Ideas by Budget: The $0, $5k and $50k Plays
Product launch ideas for a SaaS startup sorted by budget: what the launch video should be at $0, $5k and $50k, and the distribution around it.
Read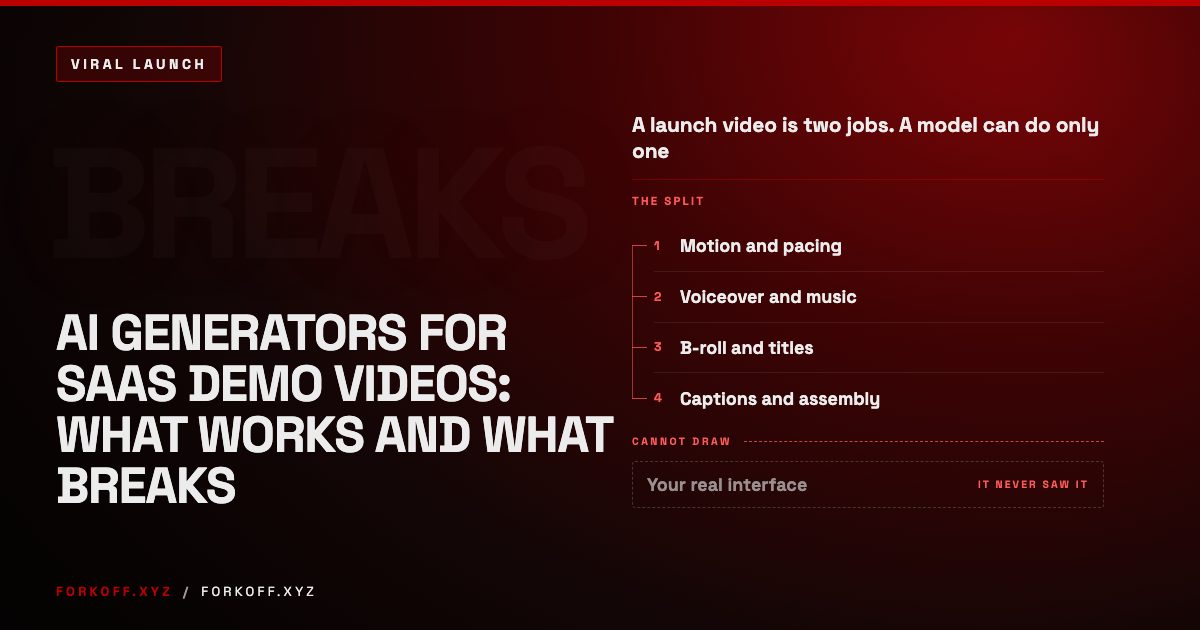
AI Generators for SaaS Demo Videos: What Works and What Breaks
AI video generators handle motion, voiceover and pacing well and draw your interface badly. Which half of a launch video to give a model, which half to keep.
Read