
FORKOFF · RADAR coverage
Launches audited acrossevery vertical
A ranked directory answers which launches read organic. This grid answers a different question: how wide is the read. RADAR has audited 30 launches spread across 6 market verticals, from AI and dev tools to fintech, crypto, and consumer, so the views-to-likes method is a general instrument, not a single-niche curiosity. Every figure below is an aggregate count; only the launches that read organic are named.
What verticals has Launch Radar audited?
Launch Radar has read 30 product launches across 6 market verticals: AI, dev tools, marketing and sales, fintech, crypto and web3, and consumer and health. The busiest is marketing and sales with 9 launches audited. Each vertical is measured with the same published, reproducible views-to-likes method, so coverage is a matter of breadth, not a different yardstick per industry. The counts below are aggregate; the launches that read organic are named and graded, and the rest are counted without a public verdict.
What counts as a tracked launch
A launch enters the RADAR corpus when it is a public product or company launch post whose engagement metrics are public and complete enough to read. RADAR records views, likes, reposts, replies, and quotes for each one, then re-pulls those figures after the launch has settled, so the 30 launches in the corpus were all measured the same way rather than screenshotted on launch day and left there.
Three rules decide whether a launch is in. First, the post has to be the launch itself, put out by the product account or the founder, not a recap thread or a press pickup. Second, every figure has to be a matured one. A like count read in the first hour is still climbing while the impressions have already run, and reading the two together manufactures a views-per-like gap that says nothing about how the reach was built. Third, nothing is modelled. Where a metric is not published, the launch stays out of the corpus instead of being estimated into it.
The corpus currently spans launches from October 2025 to June 2026. Per our own record of those posts it carries 110.4M+ views of launch reach, sitting on 145,493 likes, 20,088 reposts, 23,152 replies, and 9,642 quotes. Those four engagement layers are what a reading is built from, which is why a launch with impressive reach and no published engagement is not a launch RADAR can read.
Every launch that clears the rule gets its own page with the source post cited and the reading shown in full. The ranked view of the clean set is the verified organic directory, and the whole set is indexed on the RADAR hub.
How a launch is assigned to a market vertical
The vertical is a product-domain tag, never a verdict. RADAR assigns it from what the product actually sells into, so a payments product sits in fintech and a model router sits in dev tools whatever technology is running underneath. That distinction is the reason the axis is a market rather than a technology: nearly every launch in this corpus uses AI somewhere, so tagging on whether a product is an AI product would collapse 6 verticals into one and prove nothing about breadth.
The set is deliberately small and fixed: AI, dev tools, marketing and sales, fintech, crypto and web3, and consumer and health. A small fixed set is what makes the breadth claim checkable, because a taxonomy that grows a new label every time an odd launch arrives can always be made to look broad. Where a product genuinely spans two domains, RADAR picks the best-fit primary market and the tag stays with the launch.
Nothing about the tag touches the reading. The same views-to-likes method, the same published thresholds, and the same confidence rules run in every vertical, which is the only reason a count in crypto and a count in consumer hardware belong on the same chart. The method itself is written out in full on the RADAR methodology page.
The breadth grid
Launches audited, by vertical
Each bar is the number of launches RADAR has read in that vertical. The bone segment is how many read organic (named below); the red is the rest of the reading set, counted here with no per-name verdict. Sorted by coverage, widest first.
Marketing & Sales
up to 5.3M reach
AI
up to 14.3M reach
Dev tools
up to 6.4M reach
Consumer & Health
up to 5.7M reach
Fintech
up to 3.8M reach
Crypto/Web3
up to 3.7M reach
The same distribution, as a table
Every figure in the chart above, written out. Reach is the combined view count of the audited launches in that vertical, and the largest column is the single biggest launch RADAR has read there.
| Market vertical | Audited | Read organic | Combined reach | Largest read |
|---|---|---|---|---|
| Marketing & Sales | 9 | 1 | 27.6M | 5.3M |
| AI | 7 | 3 | 42.8M | 14.3M |
| Dev tools | 5 | 2 | 13.1M | 6.4M |
| Consumer & Health | 4 | 1 | 15.1M | 5.7M |
| Fintech | 3 | 1 | 8.0M | 3.8M |
| Crypto/Web3 | 2 | 2 | 3.8M | 3.7M |
| All verticals | 30 | 10 | 110.4M | n/a |
Independent, methodology-derived signal, not a statement of fact about any person. RADAR reads how reach was built, a signature, not an accusation. See the methodology.
How to read the grid, and what it does not claim
Each bar is a count of launches read, not a share of a market. RADAR has audited 30 launches across 6 verticals, which is enough to show the method travels and nowhere near enough to describe an industry. The honest limit is visible in the grid itself: marketing and sales carries 9 readings while crypto and web3 carries 2, so those two rows do not deserve equal confidence.
The bar length is the audited count and nothing else. It is not weighted by reach, so a vertical holding one very large launch does not stretch past a vertical holding several mid-sized ones. The bone segment inside each bar is the share of that vertical that read organic. A short bar with a long bone segment is a thin read that came back clean, not a strong result.
Selection is where the honest caveat sits. RADAR reads launches that put up enough public reach for a views-to-likes comparison to mean something, which tilts the corpus toward launches that were already visible. A launch that reached a few thousand people is not absent because it read badly, it is absent because at that size the ratio is noise. Read the grid as evidence that one method holds across markets, and read the launch authenticity report when you want the corpus-wide distribution rather than the per-vertical spread.
Breadth, not one ranked list
The verified organic directory and the leaderboard rank launches in one list. This grid does something the ranking cannot: it shows the read holds up across 6 different markets, so a launch in crypto and a launch in consumer hardware are measured the same way. A method that only worked in one niche would cluster in one vertical. This one does not.
Verified reads and reconstructed reads
Coverage counts two kinds of reading and labels them apart. Per our own trace records, 18 of the 30 launches carry a full forensic trace, and 12 are reconstructed from the published ratio and the engagement shape alone. A reconstructed launch can never earn a high-confidence amplified verdict on RADAR, however wide its views-to-likes gap looks, because the evidence needed to describe how a lift was delivered was never collected.
That rule is the reason the grid and the named set can disagree with a first impression. A launch can sit far above the organic range on the ratio and still carry a hedged, lower confidence reading, and the page will say so rather than round the label up. Confidence is a function of the evidence held, not of how striking the headline number is.
On the favorable side the same split produces the two published letters. Of the 10 organic reads, 7 carry an A for a verified organic reading and 3 carry a B where the organic read is reconstructed. Only the organic reads ever carry a public letter. The ranked version of that same safe set is the RADAR leaderboard.
The signals behind every count on this page
Every count here traces back to the same signals, applied identically in every vertical. The load-bearing one is views per like. Across this corpus the ratio runs from 98 to 12,075 with a median of 821, and roughly 500 views per like is the line RADAR treats as the top of the organic range, with a heavier band opening near 2,000.
Two more signals sit underneath it. The timing shape says whether reach arrived on a curve that engagement followed or in a block that engagement never caught up with. The corroborating layers, meaning replies and quotes rather than likes alone, say whether real conversation formed under the post. A launch that clears the ratio test but has almost no replies at its reach reads differently from one carrying a full conversation, and both facts go into the reading.
None of that is proprietary. The thresholds, the calibration, and the confidence rules are published on the methodology page, the ratio itself is benchmarked in our views-to-likes benchmark, and the wider picture of how launch videos are performing sits in the state of launch videos. A method you cannot check is a method you should not trust.
The named set
Verified organic launches, by vertical
The launches RADAR read as organic, grouped by their market vertical, each carrying its Authenticity Grade and linked to a full reading. Only the organic reads are named; the amplified reads are counted in the grid above and read one at a time on the launch authenticity study.
Marketing & Sales
1 of 9 read organicAI
3 of 7 read organicDev tools
2 of 5 read organicConsumer & Health
1 of 4 read organicFintech
1 of 3 read organicWhat the coverage grid is not saying
Paying for distribution is legal and common, and RADAR measures how reach was built rather than anyone's honesty. On this page that policy has a specific shape: every per-vertical figure is an aggregate count, the remainder of each vertical is never given a public label here, and only the 10 launches that read organic are named and graded.
The products in this corpus are real and so are the founders behind them. A reading describes a distribution signature, which is a statement about mechanics, not an accusation about a person. Where RADAR reads a lift, the wording is a signature, never a claim that anyone lied, and a launch RADAR cannot read with confidence is labelled as such instead of being called either way.
Counts are also not a ranking. A vertical with more readings is not a worse or better market, it is a market RADAR has spent more time in. If you want the per-launch detail, each reading lives on its own page with the source post cited and its confidence stated, and the amplified reads are worked through one at a time in the launch authenticity study.
How the corpus grows, and how to get a launch re-read
This grid is computed from the launch corpus itself, so a launch added to the corpus appears in its vertical without anyone editing this page. That is deliberate. A hand-maintained coverage table drifts from the data it claims to summarise within a few weeks, and a coverage claim that has quietly stopped matching the corpus is worse than no coverage claim.
Readings are added as launches are monitored, and figures already published are re-pulled when late engagement or a bot purge moves them. A re-pull can change a reading, including in the favorable direction, which is why every launch page carries the date its numbers were last checked rather than the date it was written.
If you launched something in the corpus and think the reading is wrong, the correction route and the right of reply are set out on the methodology page. If you are planning a launch instead, the reference set worth studying first is the best product launch videos, and the service that builds a launch to a view tier through genuine distribution is product launch video, with the ongoing version of the same distribution work in clipping.
A launch read the same way in any market
FORKOFF has processed 5B+ views of managed distribution, and RADAR is the measurement side of that work. Our product launch video service builds a launch to a target view tier through genuine organic distribution and a make-good if it misses, never bought reach. Read the method, or talk to a strategist.
Receipts, deep dives, and playbooks.
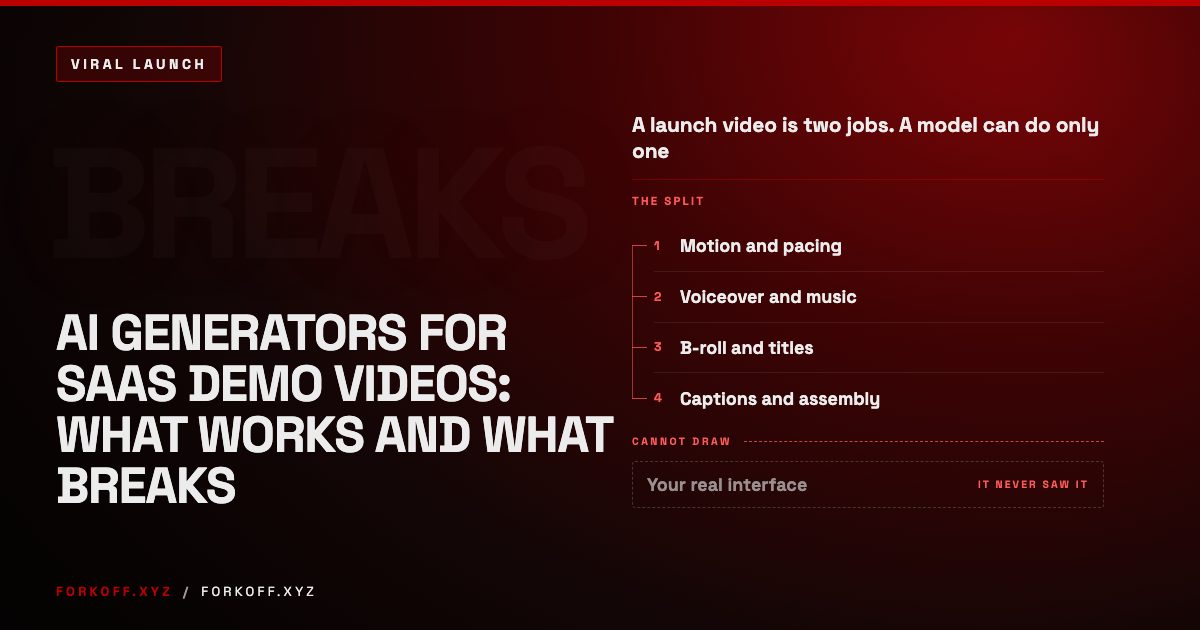
AI Generators for SaaS Demo Videos: What Works and What Breaks
AI video generators handle motion, voiceover and pacing well and draw your interface badly. Which half of a launch video to give a model, which half to keep.
 Read
Read
Why Sora Went Viral in 5 Days, and Dead in 6 Months
OpenAI's Sora beat ChatGPT to 1M downloads, then shut down 6 months later. The public download, revenue, and moderation data behind both halves.
Read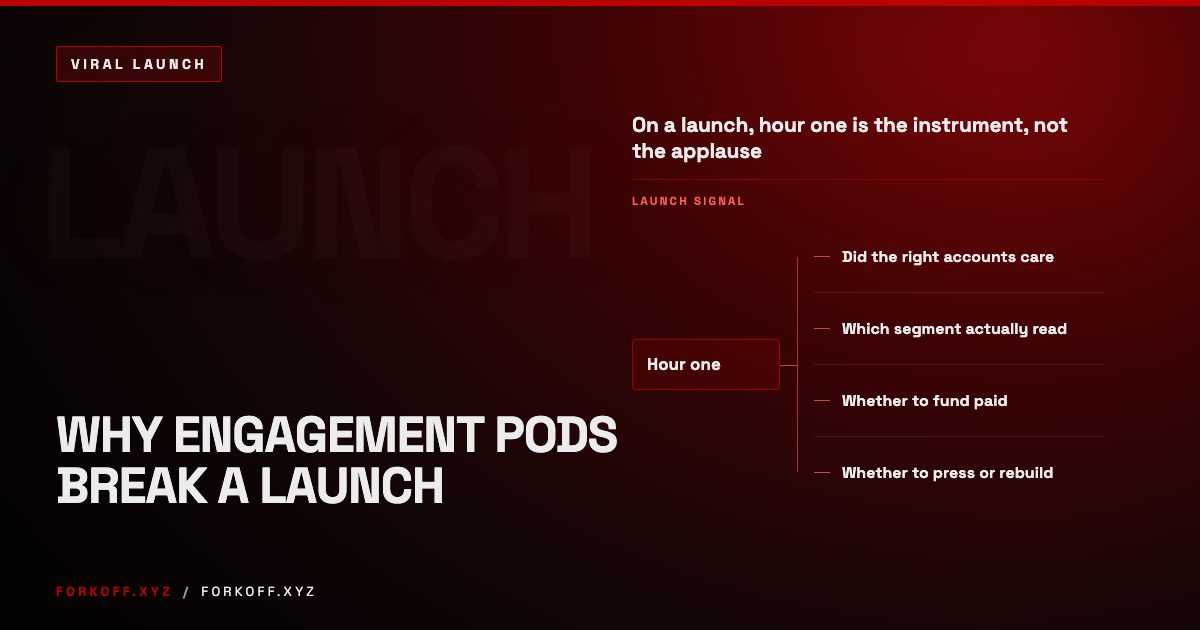
Why Engagement Pods Break a Launch
On an ordinary post a pod costs you some reach. On a launch it costs you the only measurement you had. LinkedIn's own trust VP explains where the penalty lands.
Read